Ocky did it again. A few days after his hand-made construction chart turned into bookmark links, he posted another screenshot in Discord: a table of EVE Frontier tribes ranked by total gate jumps, compiled from chain data. Underneath it, a promise to follow up with CSVs of gate and catapult owners, plus timestamps for when each was dropped or removed. He was going to assemble all of that by hand.
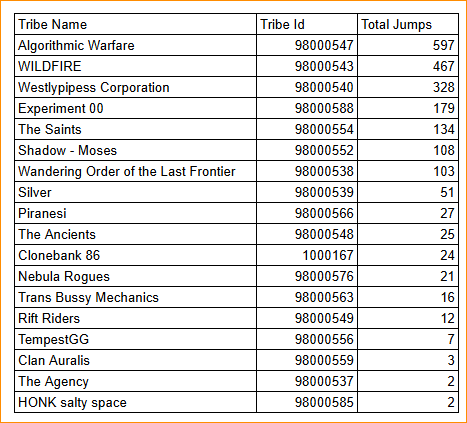
When someone in the community is hand-assembling a dataset, that is a product gap wearing a costume. It was time to look again at some data we had been deliberately throwing away.
The data we decided was useless
Our indexer has recorded every Smart Gate jump on the EVE Frontier chain for a while: source gate, destination gate, which character jumped, and when. We had never surfaced any of it, and the reasoning felt sound. Structure locations are obfuscated on-chain unless an owner reveals them, so we knew people were jumping through gates but not where those gates were. A transit log with no geography seemed like trivia.
Ocky's screenshot broke that framing. The interesting question was never where. It was who. How many gates does each tribe actually own? Who is doing the jumping? And the sharpest question of all: whose characters are jumping through whose gates? If ten gates belong to one tribe but the traffic through them belongs to another, you have found either an alliance, a toll road, or someone building infrastructure on out-of-tribe alts to keep their name off it.
Two hours, because everything already existed
The feature went from that realisation to production in roughly two hours, and the honest breakdown is the story. The jump events were already in Postgres. The ownership data was already resolved by the pipeline we built for other features. The delivery pattern — an exporter that aggregates into a snapshot, Cloudflare KV to hold it, a worker route to serve it — is the same one our killboard has used for months, so the new exporter was mostly a copy with different SQL. The panel reuses the same draggable window system, the same theme tokens, the same table styling as every other EF-Map tool.
A working version existed within the first half hour. The rest of the time was what the rest of the time always is: a human actually using the thing. The tables were too cramped at the default window size. The column headers fought the numbers underneath them. Gates that were built and torn down again cluttered the view, so a "hide unanchored" filter appeared. Then, since people clearly cared about teardown churn, each structure gained a deployment timeline. None of that is architecture. All of it is the difference between shipped and good.
What the panel actually tells you
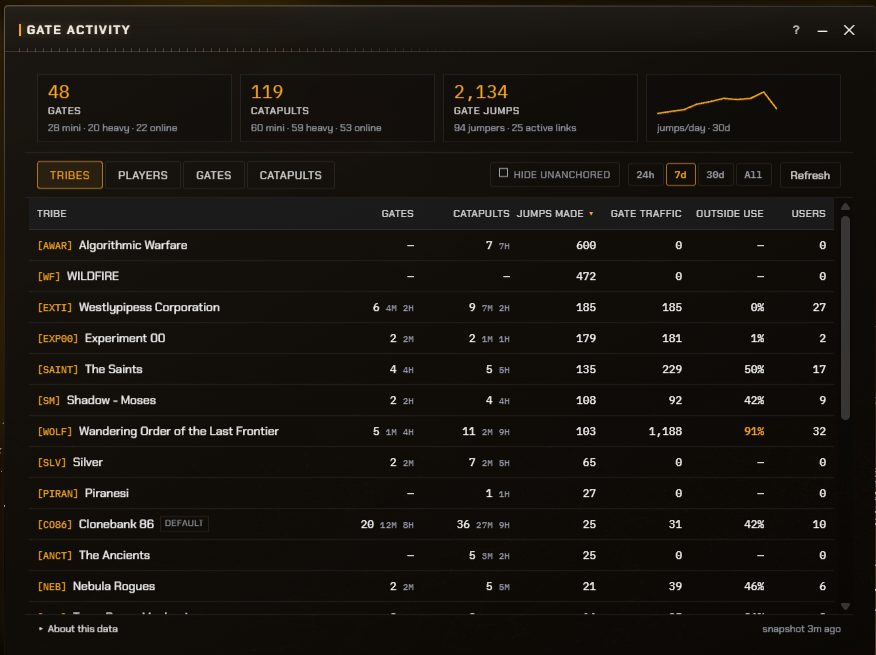
Gate Activity lives in the Tools Library and breaks down into four views. Tribes shows infrastructure owned (gates and catapults, mini and heavy), jumps made by members, traffic through the tribe's own gates, and an outside use percentage: how much of that traffic comes from non-members. Players is the same picture per character, and expanding a player lists exactly which gates they ride and who owns them. Gates lists every gate with its link partner, status, traffic and top users, tagging anyone outside the owner's tribe. Catapults lists ownership and status, with a copy button for the raw assembly ID.
Clicking any structure shows its deployment history from on-chain status events: when it was anchored, how many times it flipped online and offline, and when it was unanchored. That history has range. The churn is real — of the 48 gates ever built this cycle, only 28 are still standing — and it has comedy: one heavy catapult in the dataset was anchored and scooped again four seconds later.
The first evening with the tool produced findings we did not plan for. One tribe's gates carried over a thousand jumps at 91 percent outside use, with the top users all belonging to two other tribes — a shared network hiding in plain sight. The tribe topping the jump leaderboard owns no gates at all, just catapults. And the "biggest infrastructure owner" turned out to be the default tribe every unaffiliated character sits in, which is why that row now wears a small warning badge instead of a crown.
What the chain will not tell you
Two honest limits, both stated inside the tool. First, locations stay obfuscated, so this is deliberately a who-not-where view. Second, catapult launches emit no public on-chain event at all. Gates announce every transit; catapults are silent. A tribe fielding a large catapult fleet while barely appearing in the jump numbers is moving quietly, and that absence is itself signal — arguably the most interesting number on the page is one the chain refuses to print.
The community also made the tool better within hours of release. A player cross-checked our "owner unknown" catapults against another chain tool and found it could name the owners. That turned out to be two small bugs in our pipeline, not missing chain data: our ownership resolver was skipping unanchored structures on the false assumption they could no longer be resolved, and our status-transition table silently dropped structures that were anchored and removed too quickly. Both were fixed the same afternoon, and coverage went to one hundred percent. Cheap features are cheap to repair, too.
Comically easy is a feature
This is the part we keep relearning. When the data is already indexed, the delivery pipeline already has a pattern, and the UI already has a design system, adding a feature stops being a project and becomes an afternoon. That changes the risk maths completely. We are not scared to ship a tool like this, because almost nothing was bet on it. If a future patch obfuscates jump events, or the community stops caring, removing the panel costs nothing and strands no investment. The same economics powered the Yeet Planner and bookmark links before it: see a hand-made chart in Discord, recognise the gap, ship the tool while the conversation is still warm.
Try it
Gate Activity is live now on ef-map.com — open the Tools Library and look for Gate Activity, or press Ctrl+K and type panel gates. Every table sorts, every row expands, and the ? icon explains exactly where the data comes from and what it cannot see.
Thanks again to Ocky, whose screenshots are becoming a reliable product roadmap. If you are compiling EVE Frontier data by hand, tell us in the EF-Map Discord — the odds are good we are already sitting on it.
Related Posts
- Bookmark Links: Tracking Catapult and Gate Builds - The previous Ocky-screenshot feature: route construction tracking on the map
- Yeet Planner: Catapult Routing in EVE Frontier - Planning the same jump infrastructure this panel now audits
- Smart Gates Phased Rollout - How gate data first arrived in EF-Map
- Cloudflare KV Optimization - The snapshot pipeline pattern Gate Activity reuses