For most of the last year my development process has been the same loop. Think of a feature, get an LLM to build it, click on it, it works, ship it. I'm a vibe coder, I don't have a software engineering background, and that loop carried EF-Map from a weekend map experiment to a site with routing, killboards, intelligence panels and a 24,000 star universe view. When the app was small the loop was fine, because I could click through everything myself and know nothing else had broken. Somewhere in the last few weeks that quietly stopped being true. This post is me trying to work out what I've stumbled into instead, because I think the honest name for it is software engineering, even if I'm still not going to claim to be a software engineer.
The tests turned up before I understood them
A year ago I genuinely didn't see the point of tests. People would ask how many tests the repo had and I'd think, I build a feature, I test it by using it, it works, what would a test even be for? And for a small app I still think that was roughly right. What changed is that the agents got good enough to work unattended for five or six hours, and when I started handing them big overnight jobs, an orchestrator directing sub-agents, I noticed they were adding tests without being asked. Not for my benefit. For theirs. An agent six hours into a job needs a way to check it hasn't broken the other eighty features while it works on the eighty-first, and a test suite is exactly that.
So the tests arrived almost by accident, and then they compounded. The controller support build added 421 of them on its own. Then a couple of nights ago I ran a dedicated coverage night, which took the suite to about 5,563 tests and, more usefully, measured for the first time how much of the code they actually protect. The answer was 28.89% overall, with the backend worker at around 72%. I don't really have an instinct yet for whether those are good numbers. But I now understand what they're for, which is a bigger shift than the numbers themselves. The tests are tripwires. The more of them there are, the more change the repo can safely absorb while I'm asleep.
Twelve suggestions and none of them are features
The thing that crystallised this was a conversation with ChatGPT. I asked it what long-running overnight tasks the repo could use, expecting feature ideas, and it came back with twelve proposals and not one of them was a feature. Attack every API route with malformed input and prove the error handling. Drive the 1,214 lint errors to zero and make that a permanent gate. Build one command that tells any agent, you did not break EF-Map. Inject faults, kill the database mid-download, corrupt storage, and prove nothing sticks on a spinner forever. Hunt for leaked textures after entering and leaving solar systems a hundred times. None of these would have crossed my mind in a year of building. But the moment they were pointed out I could see the value in every one of them.
What it said about the timing stuck with me too. These jobs would have been a waste of effort when EF-Map was ten files, because there was nothing worth protecting yet. A performance budget matters when one careless import can drag a whole wallet SDK back into the startup bundle, which is a real thing that happened here in July and went unnoticed for 19 days. So I don't think I've been doing it wrong for a year. I think most of this is just the bill arriving at the point where the app is big enough, and the agents capable enough, for it to be worth paying. Features add things the site can do. These runs add how much change the site can survive. That framing was new to me.
Last night the map went on a diet
The first of these engineering nights to actually run was the boot-path diet, and it makes a decent worked example. EF-Map had grown to the point where the JavaScript needed just to start the app was about 952,000 bytes compressed, and three quarters of that was one giant file containing nearly every panel on the site. Some of that was self-inflicted. A translation night a couple of days earlier had grown the English language catalogue to 300 KB and it was all being shipped up front, so one night's improvement quietly became the next night's problem. Google has opinions about this stuff, Search Console sorts your pages into good and bad URLs and I believe the main loading threshold is about two and a half seconds. On my gigabit connection I never felt any of it, which is probably why it took an outside suggestion for me to look.
The run itself was the new shape of working. Three analysis agents went through the code in parallel first, one on the translations, one on which panels were being loaded eagerly, one on the third party libraries. Their reports got merged into a ranked list, then the wins were applied one at a time, each one measured, tested and committed on its own so anything that didn't pay for itself could be thrown back. An adversarial review agent then went through the whole thing trying to prove the numbers wrong and the behaviour changed. It found nothing blocking, which I'm told I should treat with suspicion, but the numbers held.
| Startup JavaScript before | about 952,000 bytes compressed |
| Startup JavaScript after | about 718,000 bytes compressed |
| Reduction | 24.6% |
| Individual wins landed | 12, one commit each |
| Tests passing throughout | 5,574 |
| Analysis and review agents | 4 |
| Tokens across those agents | about 600,000 |
| Wall clock | about four and a half hours |
The bit I find most software-engineery about it is the last commit. The repo has a guard script that fails the build if the startup bundle grows past a budget, and the run finished by lowering that budget from 1.1 million bytes to 753,000. So the win isn't a one-off, it's enforced. If a future feature accidentally drags something heavy back into the boot path, the build goes red before it ships. That's the same lesson as the wallet SDK incident, encoded permanently. Nobody has to remember it, including me.
The regression that isn't one
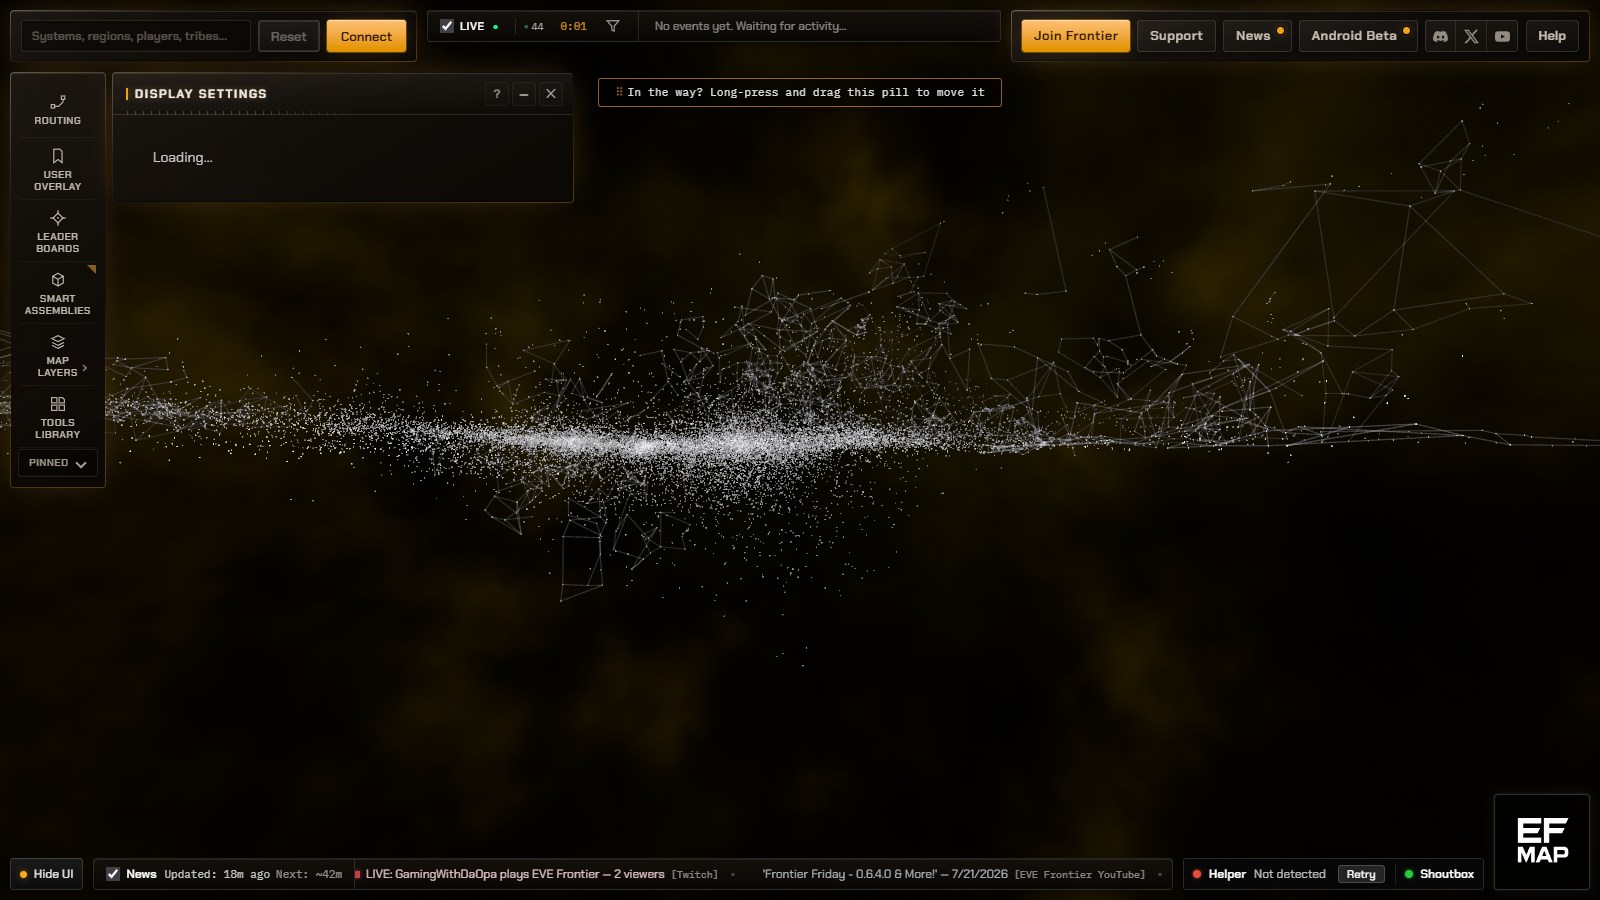
Here's the part that surprised me most, and it's a feeling thing rather than a numbers thing. Before the diet, every panel shipped up front, so clicking Display Settings opened it instantly. Now the panel's code loads the first time you open it, and for a moment you see the frame with a small Loading note in it. The first time I saw that I thought, we've made the site slower. It genuinely feels like a regression. But the site now starts a quarter lighter for every single visitor, and the cost is a one-off beat of loading on panels most visitors never open at all. My fast connection had been hiding the first-load cost from me for a year while other people presumably felt it.
I asked, half joking, whether this is what software engineering actually is, trade-offs. As far as I can tell the answer is mostly yes. Nothing was free here, the run just moved the cost from everyone at startup to some people on first click, and made the map usable sooner. Once you see it that way you can't unsee it, and I now suspect half the decisions I've been letting agents make for me have been trade-offs like this that I never noticed being made.
Two lines of work at once
The other thing that happened this week is that time, not inference, started to look like the limit. While the diet run was going I got an itch to build a new feature, the Item Codex, in a completely separate chat, and it shipped to production while the diet branch was still being worked. So by evening there were two lines of work that had never met. The fix was something I'd only just learned about, an integration branch. Merge one into the other on a throwaway branch, let the gates run, and see what breaks. Git found two textual conflicts and the agent resolved them, but the more interesting catches were the ones git can't see. A build-time check noticed the new feature had added translation keys the boot bundle needed, and the test suite confirmed the two pieces of work coexisted. Preview, click around, merge, deploy. The known-good main branch never carried anything unproven.
That's the pattern I can see coming next. Not one overnight run but two or three at once, on deliberately non-overlapping parts of the repo, with an integration morning afterwards. Which runs can share a night and which have to queue is exactly the kind of question I'd never have thought to ask a year ago, and now it's sitting in a roadmap doc in the repo with ten more of these engineering nights ranked and waiting.
The names of them are half the fun, honestly. Adversarial Worker and API night is next in the queue, a night of agents attacking every backend route with malformed junk to prove the error handling holds. There's Frontend Chaos night, which as far as I can tell is agents going to work and just breaking everything on purpose, killing the database mid-download, corrupting storage, cutting the connection, to prove nothing ever gets stuck on a spinner. Lint-to-Zero night for the 1,214 style warnings I've been cheerfully ignoring. Telemetry Integrity night, proving the numbers the site reports about itself are actually true. And the one I find weirdly fascinating, Data-pipeline Disaster Recovery night, where the agents rebuild the entire data estate from scratch in a clean room to prove it could all be regenerated if I lost it. A year ago that list would have bored me senseless. Now it reads like the to-do list that makes the next year of features possible.
If I started a new repo tomorrow I'd probably put the tests and the budgets in from day one. Or maybe I wouldn't, maybe the early speed was the whole point and this stuff only earns its keep once something is worth protecting. I honestly don't know yet.
So that's where I've ended up. Still a vibe coder, still not writing the code, but the questions have changed from can you build this to how do we know nothing else broke, and it turns out that second question is most of the job. If you load EF-Map and a panel says Loading for half a second where it used to be instant, that's not the site getting slower, that's the trade that made it start faster. And if anything genuinely is broken, let me know and I'll get it sorted.
Related Posts
- A year of EF-Map, read back from its own decision log - the year of build it, click it, ship it that led here
- Vibe Coding: Building a 124,000-Line Project in 3 Months Without Writing Code - what I thought about all this back in November, before the overnight runs existed
- Three apps in one day, dictated from inside a video game - the orchestrator and sub-agent setup these runs are built on
- Controller Support for EF-Map: Flight Mode and Recorded Camera Flights - the overnight feature build that added 421 tests without being asked