Cycle 6 of EVE Frontier started on 25 June 2026 and ended when the servers went down for the reset on 29 September, so that's the cycle done. Back in August I wrote a halfway report that laid the first seven weekly State of the Frontier reports end to end, and I said I'd do the full-cycle version when it finished. This is that. Same idea, the whole record: every weekly report from the cycle, the closing few days, and a whole-cycle pull from EF-Map's indexer for the things you can't add up week by week, like how many different people were active across the entire cycle.
It's a lot of charts. If you're sat waiting for the Cycle 7 servers, that's sort of the point.
How to read this
The weekly lines come from the 13 published State of the Frontier fact packs, weeks ending 2 July to 24 September, plus the closing window from 24 September to the data cut-off at 09:00 UTC on 29 September. That last window is only 5.4 days long, so it's hatched or dashed in every chart and I've compared it per day where it matters. Cycle totals, the daily lines, the leaderboards and the cycle-wide player counts come from a separate read-only extract of the whole cycle up to the same cut-off.
Killmails can land on chain a good while after the fight, so a week's kill count keeps creeping up after its report goes out. The weekly issues printed 6,502 kills between them and the killboard now holds 7,565 for the same period, 16% more. I show both. Everything here is recorded on-chain activity as EF-Map's indexer saw it, not logins and not concurrent players. Tribe names are membership at the end of the cycle, not at the time of each kill. And Clonebank 86 is the NPC corporation new characters start in, so wherever it shows up in a table it really means pilots who weren't in a player tribe.
Cycle 6 at a glance
| Metric | Cycle 6 |
|---|---|
| Recorded kills | 7,565 |
| Structure kills | 3,583 (47% of kills) |
| Pilots with at least one kill | 361 |
| Distinct victims | 3,856 |
| Systems with at least one kill | 99 |
| FOAM destroyed, priced kills only | 56,905 across 50 kills |
| Chain-active players across the cycle | 2,150 |
| Tribes with recorded activity | 99 |
| Characters in EF-Map's Cycle 6 character table | 18,121 |
| Recorded activity events | 670,918 |
| Assemblies deployed and tracked | 25,674 |
| Structures online at the end | 3,930 |
| Most structures online at a weekly boundary | 4,297 (week ending 20 Aug) |
| Active Smart Gate links at the end | 149 |
| Smart Gate jumps | 16,303 by 295 pilots |
| Shared storage transfers | 18,488 by 177 characters |
The one I find most interesting is the 2,150, because no weekly report can give it to you. Each week the reports counted who was active that week, and those numbers can't be added together without counting the same people over and over. Across the whole cycle, 2,150 different players did at least one thing on chain that the Activity Tracker records. Put that next to the 18,121 characters in the character table and you get a feel for how many characters exist without ever anchoring, minting, jumping or fighting in a way the chain can see. Some of that will be alts, some people who logged in once and bounced, and some people who play without touching anything on chain. I can't separate those, so I won't try.
| Week ending | Kills (published) | Kills (now) | Active players | Activity events | Online structures | Active gate links |
|---|---|---|---|---|---|---|
| 2 Jul | 869 | 994 | 667 | 33,913 | 2,088 | 0 |
| 9 Jul | 297 | 466 | 537 | 33,354 | 3,062 | 3 |
| 16 Jul | 762 | 830 | 602 | 84,317 | 3,725 | 25 |
| 23 Jul | 370 | 455 | 556 | 65,377 | 4,021 | 37 |
| 30 Jul | 474 | 634 | 459 | 58,818 | 4,172 | 43 |
| 6 Aug | 512 | 657 | 401 | 63,118 | 4,264 | 58 |
| 13 Aug | 347 | 456 | 358 | 55,444 | 4,157 | 72 |
| 20 Aug | 437 | 493 | 366 | 53,175 | 4,297 | 94 |
| 27 Aug | 457 | 519 | 359 | 49,042 | 4,265 | 108 |
| 3 Sep | 474 | 499 | 308 | 46,751 | 4,289 | 132 |
| 10 Sep | 148 | 162 | 261 | 39,192 | 4,075 | 138 |
| 17 Sep | 249 | 294 | 264 | 29,839 | 3,924 | 145 |
| 24 Sep | 562 | 562 | 306 | 35,756 | 4,100 | 149 |
| 29 Sep (5.4 days) | 544 | 544 | 321 | 22,233 | 3,930 | 149 |
Kills over the cycle
Week one is still the bloodiest week of the cycle, 869 kills as published and 994 on the killboard now, which is what a fresh wipe looks like. After that the weekly line bounced between 148 and 762 without ever settling into a trend, same as it looked at halfway. The quietest week was the one ending 10 Sep. The closing window recorded 544 kills in 5.4 days, about 101 a day, against a cycle average of 65 a day across the full weeks.
Table view
| Week ending | Published | Now | Structure kills | Unique killers | Systems with kills |
|---|---|---|---|---|---|
| 2 Jul | 869 | 994 | 0 | 123 | 26 |
| 9 Jul | 297 | 466 | 145 | 52 | 31 |
| 16 Jul | 762 | 830 | 614 | 67 | 35 |
| 23 Jul | 370 | 455 | 281 | 39 | 34 |
| 30 Jul | 474 | 634 | 375 | 43 | 34 |
| 6 Aug | 512 | 657 | 324 | 44 | 32 |
| 13 Aug | 347 | 456 | 183 | 35 | 34 |
| 20 Aug | 437 | 493 | 285 | 26 | 35 |
| 27 Aug | 457 | 519 | 167 | 22 | 26 |
| 3 Sep | 474 | 499 | 169 | 22 | 30 |
| 10 Sep | 148 | 162 | 51 | 18 | 27 |
| 17 Sep | 249 | 294 | 125 | 23 | 26 |
| 24 Sep | 562 | 562 | 149 | 36 | 37 |
| 29 Sep (5.4 days) | 544 | 544 | 108 | 30 | 25 |
The gap between the bars and the line is the backfill. Over the cycle it came to 1,063 kills that no weekly issue ever showed. The biggest single correction was the week ending 9 Jul, which went from 297 as published to 466 now. So if you ever wondered why a Friday report's number looked low compared to what you saw on the killboard later, that's why.
The daily numbers are spikier. The busiest single day was 26 June with 318 kills, then 8 July with 229 and 12 July with 189. Half the full days of the cycle had 68 kills or fewer, and the big days stand out a mile on the chart below.
Busiest days
| Day | Recorded kills |
|---|---|
| 26 June | 318 |
| 8 July | 229 |
| 12 July | 189 |
| 4 August | 188 |
| 24 September | 185 |
| 27 June | 184 |
| 25 June | 179 |
| 23 September | 160 |
| 25 September | 152 |
| 28 June | 145 |
And for anyone planning when to undock in Cycle 7, here's when the killing happened. The day of the week matters less than you might think. Thursday was the busiest and Monday the quietest, 33% apart. The hour matters a lot more. 23:00 to 02:00 UTC was the busiest three hours of the day and 08:00 to 11:00 UTC the quietest, roughly 3.8 times apart. I'd read that as a player base spread across the American evening and the European late night, but that's me reading a clock, not something the data proves.
Who did the killing
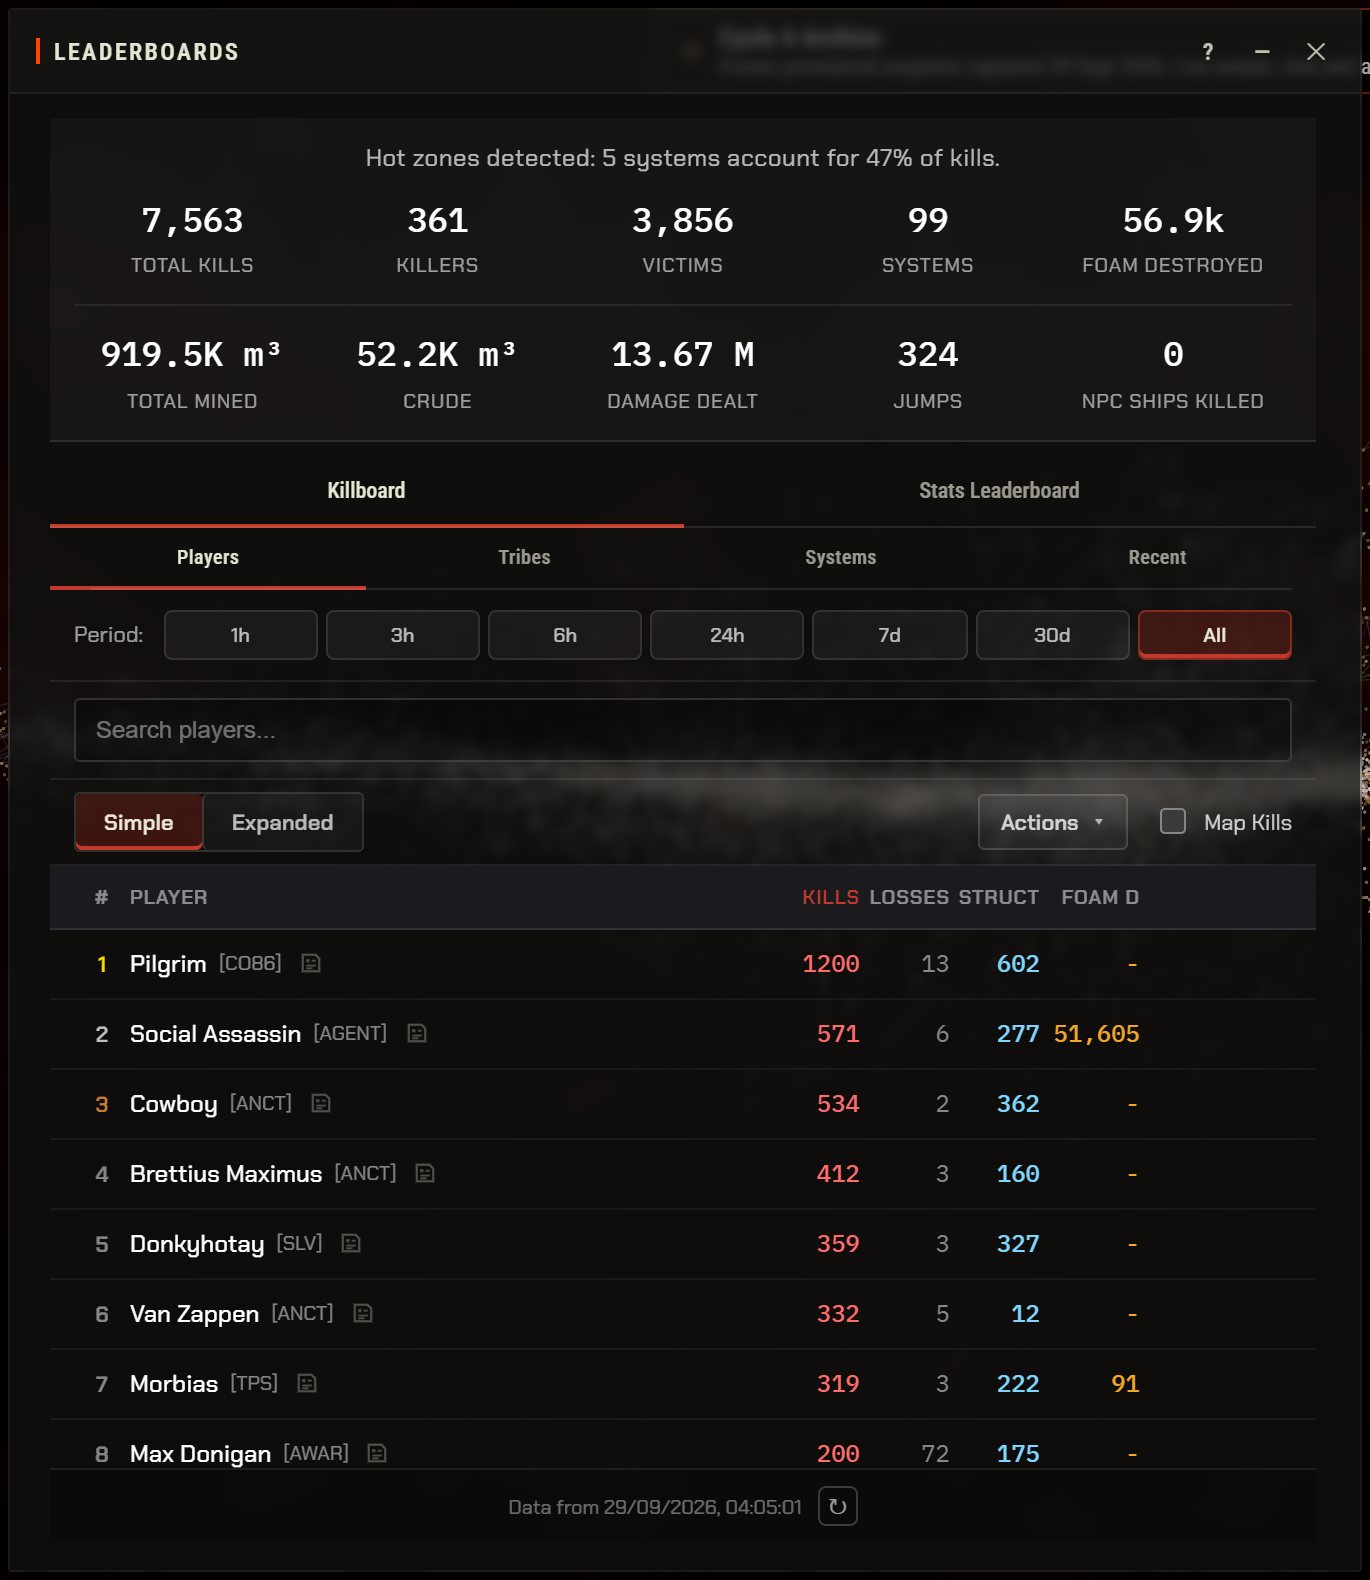
Pilgrim ends the cycle top of the killboard with 1,200 kills, more than double anybody else, and topped 6 of the 14 weekly player tables along the way, and finished the cycle outside any player tribe, which is why the name sits under Clonebank 86. Behind that it's Social Assassin on 573, Cowboy on 534 and Brettius Maximus on 412. The table has ten, with the caveat that the tribe column is where each pilot ended up, not where they were for every kill.
| # | Pilot | Tribe | Kills | Structure kills | Distinct victims | Systems |
|---|---|---|---|---|---|---|
| 1 | Pilgrim | Clonebank 86 [CO86] | 1,200 | 602 | 834 | 24 |
| 2 | Social Assassin | The Agency [AGENT] | 573 | 278 | 312 | 40 |
| 3 | Cowboy | The Ancients [ANCT] | 534 | 362 | 323 | 17 |
| 4 | Brettius Maximus | The Ancients [ANCT] | 412 | 160 | 341 | 17 |
| 5 | Donkyhotay | Silver [SLV] | 359 | 327 | 249 | 25 |
| 6 | Van Zappen | The Ancients [ANCT] | 332 | 12 | 312 | 14 |
| 7 | Morbias | The Perfect Singularity [TPS] | 319 | 222 | 210 | 9 |
| 8 | Max Donigan | Algorithmic Warfare [AWAR] | 200 | 175 | 85 | 8 |
| 9 | Mort | The Perfect Singularity [TPS] | 173 | 102 | 147 | 20 |
| 10 | Heckmo | Clonebank 86 [CO86] | 159 | 25 | 132 | 10 |
On the tribe side, The Ancients lead the player tribes with 1,730 kills from only 21 pilots and topped the weekly tribe table 5 times. Clonebank 86 has more kills in total, 1,921, but that's 148 different pilots with no player tribe between them, and it also took 5,107 losses, 68% of every loss in the cycle. That'll mostly be new players and solo pilots, which is roughly what you'd expect. The most kills per pilot among the top ten goes to The Perfect Singularity: 556 kills from 5 pilots. I've added each tribe's recorded chain activity as the last column, because kills are only one way to be busy.
| Tribe | Kills | Structure kills | Pilots | Losses | Activity events |
|---|---|---|---|---|---|
| Clonebank 86 [CO86] (NPC starter corp) | 1,921 | 737 | 148 | 5,107 | 369,489 |
| The Ancients [ANCT] | 1,730 | 819 | 21 | 153 | 25,408 |
| The Agency [AGENT] | 800 | 408 | 26 | 103 | 11,869 |
| Silver [SLV] | 746 | 493 | 12 | 254 | 24,619 |
| Reapers [REAP] | 739 | 213 | 45 | 291 | 32,662 |
| The Perfect Singularity [TPS] | 556 | 359 | 5 | 49 | 11,696 |
| Shadow - Moses [SM] | 364 | 240 | 10 | 15 | 4,982 |
| Algorithmic Warfare [AWAR] | 239 | 178 | 8 | 285 | 25,126 |
| Jita Exiles [JTX] | 110 | 66 | 1 | 8 | 2,595 |
| Westlypipess Corporation [EXTI] | 64 | 10 | 12 | 177 | 26,440 |
The fighting was concentrated. Kills landed in 99 systems, but the top five took 47% of them and I8V-PCH on its own took 1,116. Four of the top ten sit in the same region, SF0-Y-02. If you lived in one of these, you already knew.
| # | System | Region | Kills | Structure kills | Pilots with kills |
|---|---|---|---|---|---|
| 1 | I8V-PCH | 4H2-Y-52 | 1,116 | 412 | 100 |
| 2 | UD5-8RH | 4H2-Y-52 | 745 | 245 | 77 |
| 3 | D.QMV.S31 | KR.T1.R8 | 743 | 83 | 62 |
| 4 | O9R-S3L | SF0-Y-02 | 479 | 388 | 31 |
| 5 | A.XLP.GTR | KR.T1.R8 | 477 | 360 | 20 |
| 6 | C.9GL.QK1 | KR.T1.R8 | 459 | 123 | 45 |
| 7 | OS9-C0L | SF0-Y-02 | 454 | 86 | 31 |
| 8 | O1B-32L | SF0-Y-02 | 367 | 48 | 54 |
| 9 | E7J-1KK | SF0-Y-02 | 297 | 17 | 37 |
| 10 | Eimur | Silent Domain | 262 | 196 | 17 |
The killboard also prices kills in FOAM where it can match what died to a known FOAM cost. 56,905 FOAM was destroyed across the 50 kills it could price, and 43,000 of that was 10 Heavy Gates, with 3 Heavy Catapults adding another 12,900. Most kills don't match a FOAM value at all, so treat that total as a floor rather than the real bill.
The build-out
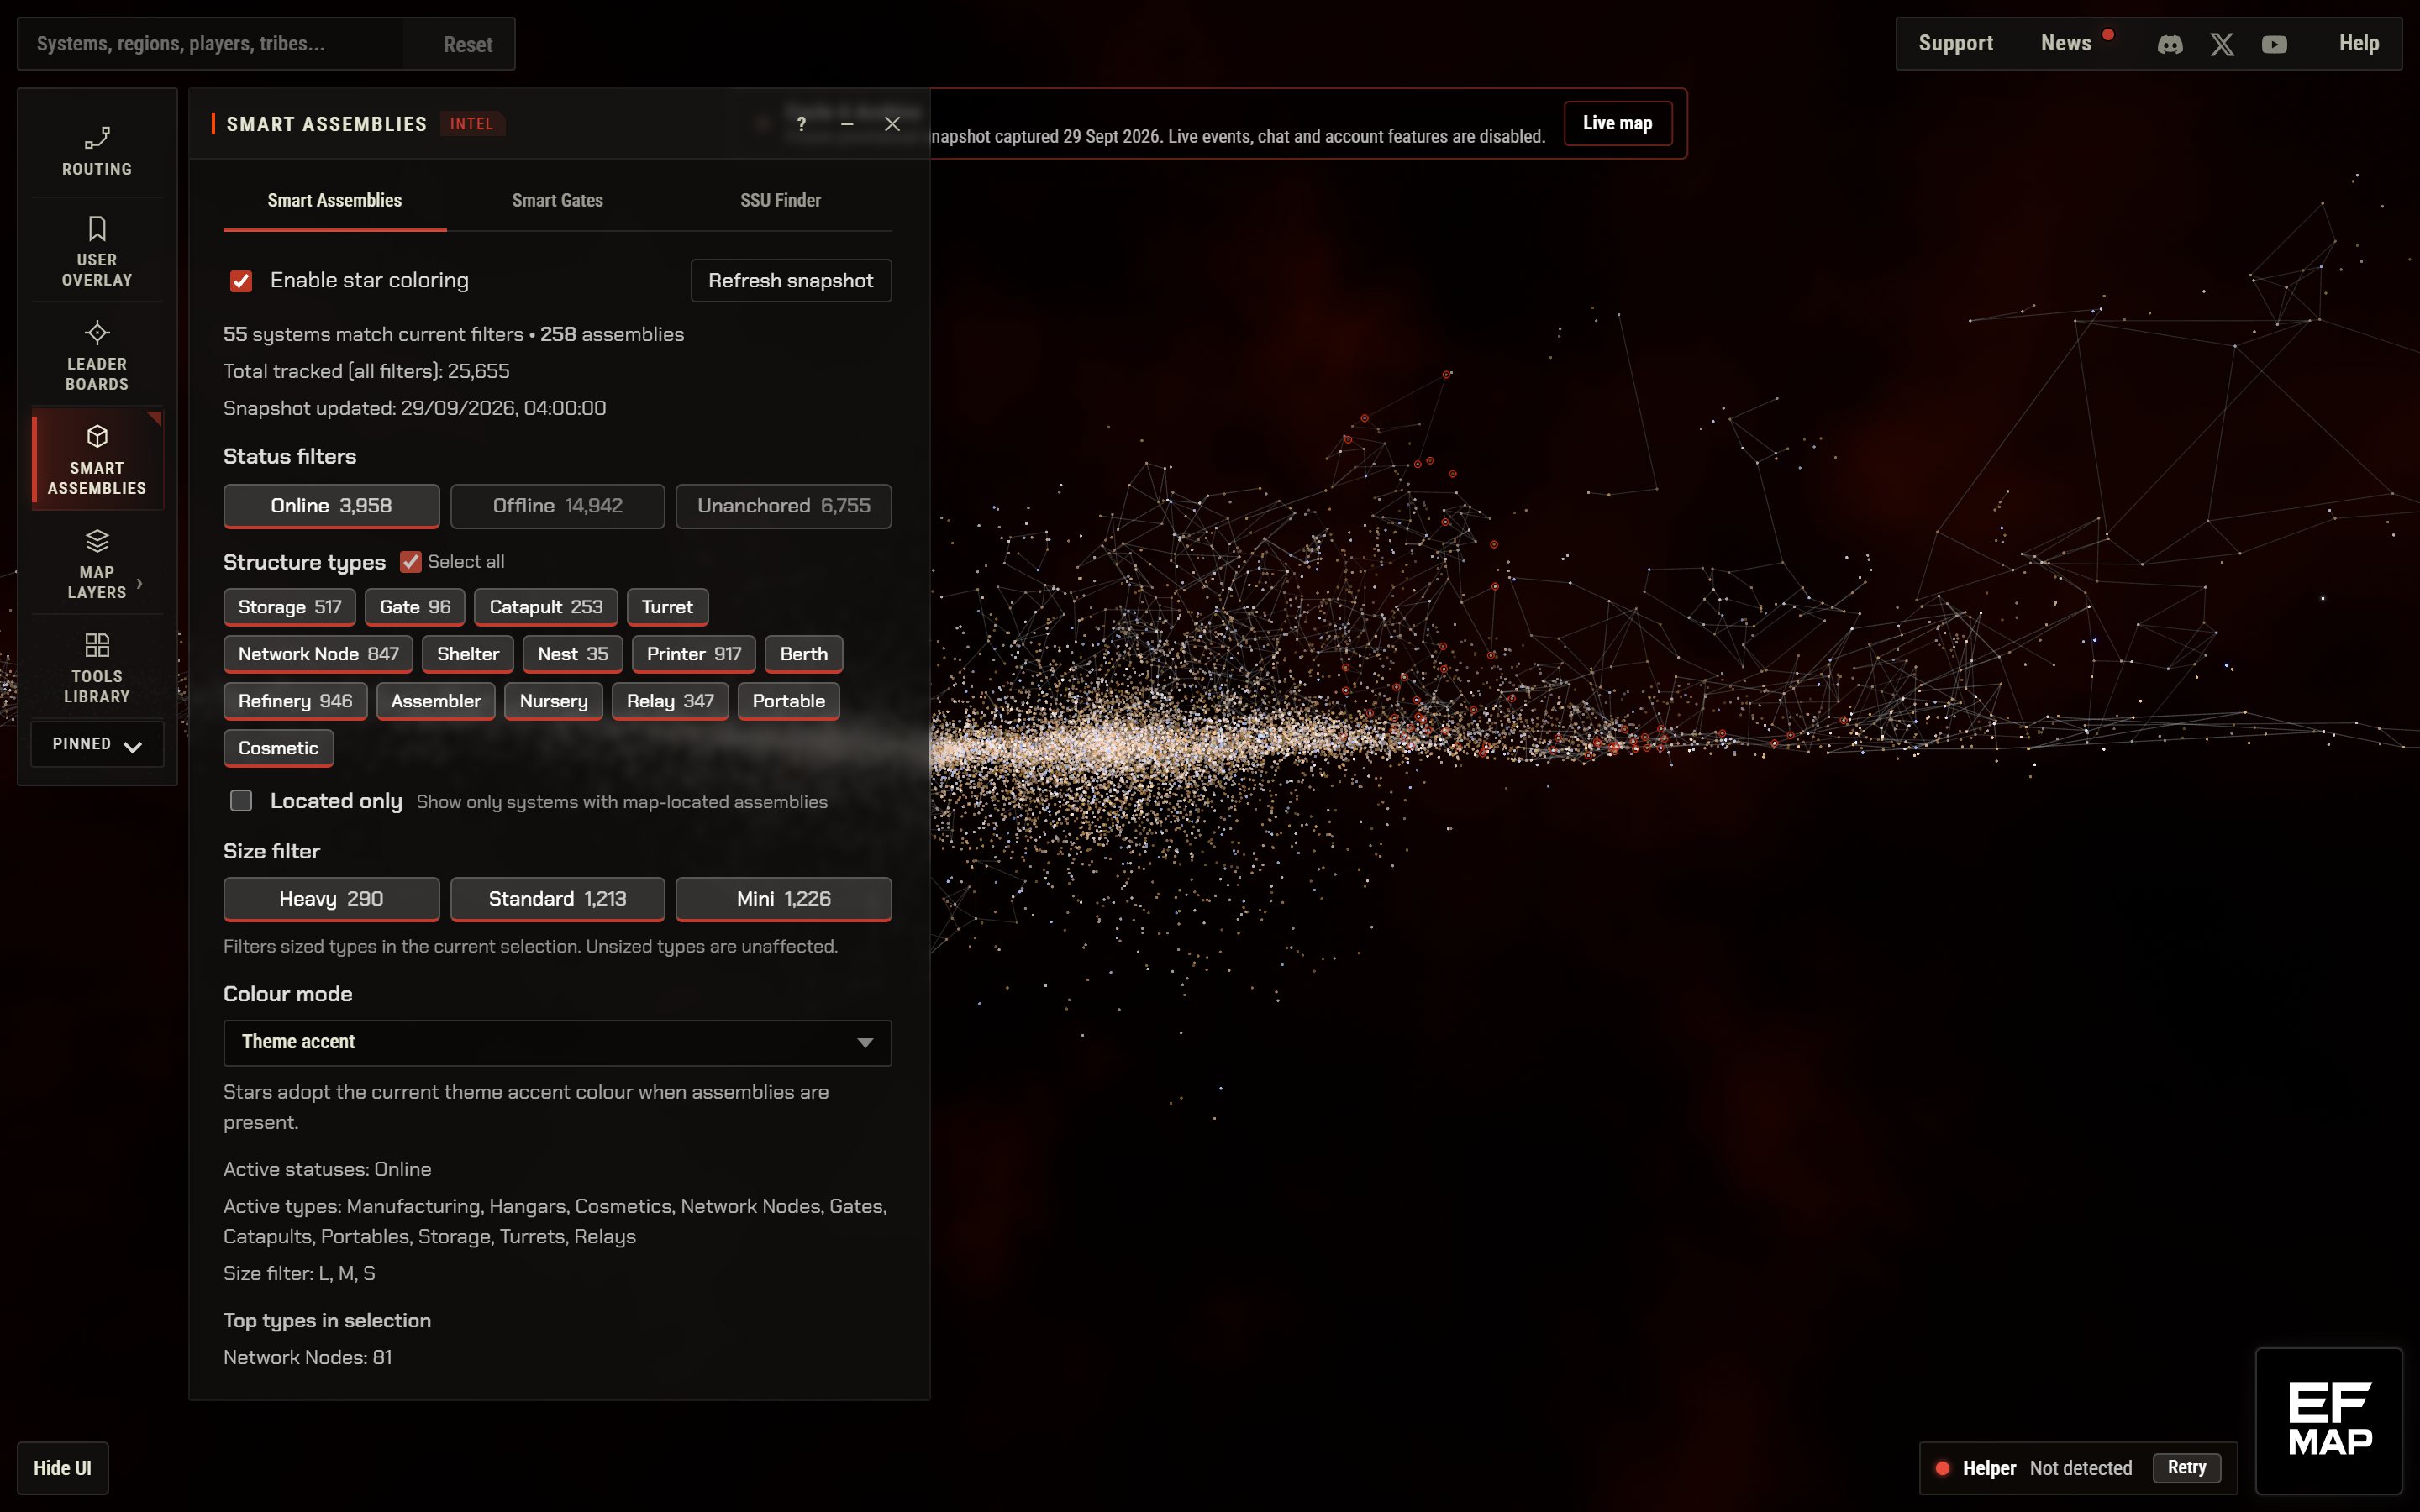
The indexer tracked 4,191 assemblies at the end of week one and 25,674 at the end of the cycle, and that count went up at every single weekly boundary. It's everything deployed this cycle, including 6,763 that were later unanchored, so read it as how much got built rather than how much was left standing. Online structures tell a different story. They climbed from 2,088 to a high of 4,297 at the week ending 20 Aug, then drifted down to 3,930 by the end. At the cut-off only 15% of tracked assemblies were online, with 14,985 anchored but offline.
Table view
| Week ending | Assemblies tracked | Structures online | Status changes | Active gate links |
|---|---|---|---|---|
| 2 Jul | 4,191 | 2,088 | 7,868 | 0 |
| 9 Jul | 6,818 | 3,062 | 8,463 | 3 |
| 16 Jul | 10,250 | 3,725 | 11,448 | 25 |
| 23 Jul | 12,995 | 4,021 | 10,403 | 37 |
| 30 Jul | 15,036 | 4,172 | 10,249 | 43 |
| 6 Aug | 17,264 | 4,264 | 9,901 | 58 |
| 13 Aug | 18,642 | 4,157 | 7,548 | 72 |
| 20 Aug | 20,099 | 4,297 | 8,313 | 94 |
| 27 Aug | 21,394 | 4,265 | 6,907 | 108 |
| 3 Sep | 22,719 | 4,289 | 6,744 | 132 |
| 10 Sep | 23,385 | 4,075 | 6,213 | 138 |
| 17 Sep | 23,843 | 3,924 | 4,544 | 145 |
| 24 Sep | 25,074 | 4,100 | 5,657 | 149 |
| 29 Sep (5.4 days) | 25,674 | 3,930 | 4,550 | 149 |
Status changes, meaning structures going online, going offline or being unanchored, peaked at 11,448 in the week ending 16 Jul and were down to 5,657 by the last full week. My reading is that most of the building happened in the first month or so, and after that the job was keeping things fuelled and running. Here's how the end state splits by type.
| Type | Tracked | Online | Anchored, offline | Unanchored |
|---|---|---|---|---|
| Other Smart Assemblies (turrets, printers, refineries and the rest) | 16,972 | 2,470 | 10,094 | 4,408 |
| Network Nodes | 5,614 | 844 | 3,321 | 1,449 |
| Storage Units | 2,874 | 517 | 1,528 | 829 |
| Smart Gates | 214 | 95 | 42 | 77 |
Smart Gates and travel
The player-built gate network went up at every weekly report too, and unlike the assembly count it only counts links that were actually live. There were no active player-built links at the first report and 149 at the end, holding steady through the closing days. Over the cycle players created 214 gates, with 119 link events and 61 unlinks along the way. Whatever else was going on, somebody kept laying track all cycle.
Table view
| Week ending | Gates created | Link events | Unlink events | Active links |
|---|---|---|---|---|
| 2 Jul | 0 | 0 | 0 | 0 |
| 9 Jul | 9 | 2 | 1 | 3 |
| 16 Jul | 38 | 26 | 17 | 25 |
| 23 Jul | 16 | 10 | 8 | 37 |
| 30 Jul | 18 | 6 | 7 | 43 |
| 6 Aug | 16 | 12 | 4 | 58 |
| 13 Aug | 12 | 5 | 3 | 72 |
| 20 Aug | 33 | 15 | 0 | 94 |
| 27 Aug | 18 | 10 | 3 | 108 |
| 3 Sep | 22 | 10 | 1 | 132 |
| 10 Sep | 12 | 5 | 0 | 138 |
| 17 Sep | 8 | 8 | 4 | 145 |
| 24 Sep | 9 | 7 | 10 | 149 |
| 29 Sep (5.4 days) | 3 | 3 | 3 | 149 |
And people used it. 16,303 gate jumps by 295 different pilots through 160 gates. Jumps were a trickle for the first fortnight, crossed a thousand a week in the week ending 16 Jul, and from then on sat between 1,060 and 1,993 a week for the rest of the cycle, which is about as steady as anything in this data gets.
Busiest routes
| From | To | Jumps | Pilots |
|---|---|---|---|
| U:1RA5 | A00-R3L | 589 | 65 |
| unrevealed (gate named "Going Down") | unrevealed | 530 | 26 |
| unrevealed (gate named "Going Up") | unrevealed | 461 | 29 |
| IDV-M5L | U:1RA5 | 445 | 71 |
| A00-R3L | U:1RA5 | 440 | 48 |
| unrevealed (gate named "C.FZ9.SG1") | unrevealed | 429 | 15 |
Activity and players
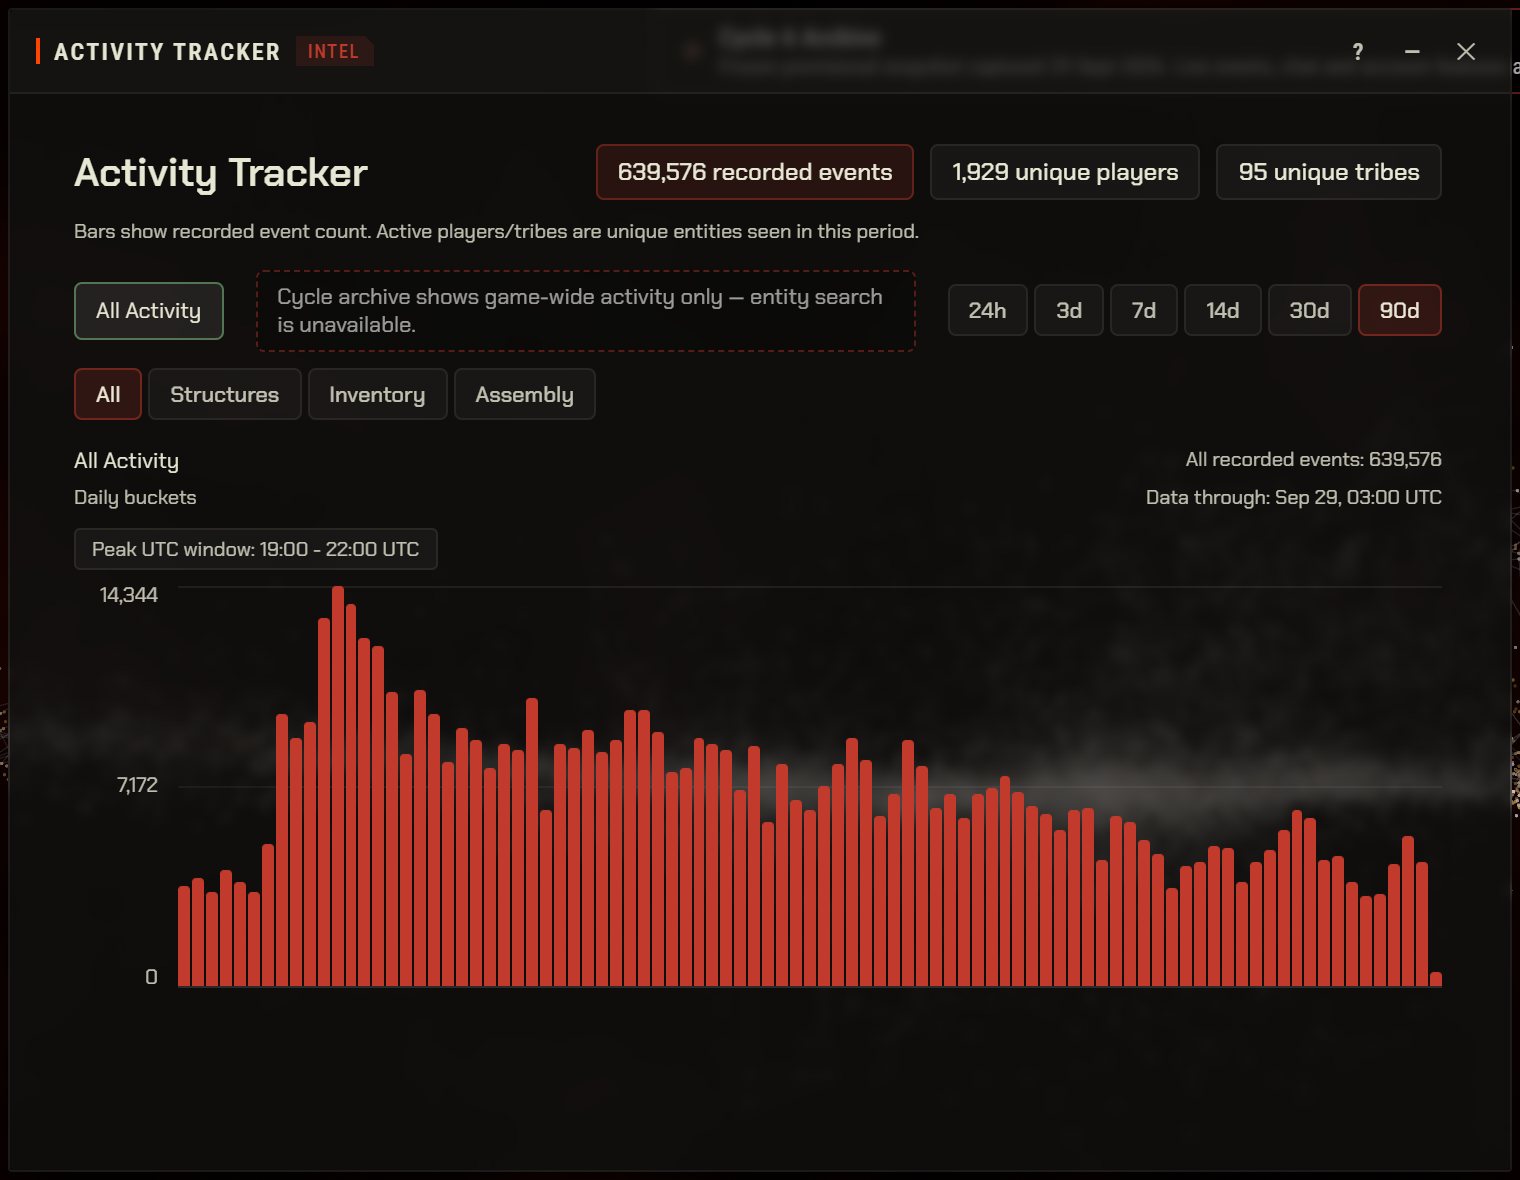
Recorded player-triggered activity peaked in the week ending 16 Jul at 84,317 events, the week the 14 July modules patch landed, and eased down for most of the cycle after that. The quietest full week was the one ending 17 Sep, at 29,839. The closing window recorded 22,233 in 5.4 days, about 4,133 a day, against 5,108 a day in the last full week. Across the whole cycle that's 670,918 recorded events.
Events by type, whole cycle
| Event type | Cycle total | Busiest full week |
|---|---|---|
| Items minted | 348,113 | 16 Jul (45,906) |
| Items burned | 169,638 | 16 Jul (21,950) |
| Structures brought online | 50,051 | 16 Jul (5,750) |
| Structure anchors | 25,674 | 2 Jul (3,891) |
| Fuel burn starts | 17,817 | 2 Jul (2,161) |
| Assembly creations | 16,972 | 2 Jul (2,530) |
| Jumps | 16,303 | 23 Jul (1,993) |
| Item withdrawals | 8,218 | 13 Aug (1,406) |
| Item deposits | 8,198 | 13 Aug (1,406) |
| Network Node creations | 5,614 | 2 Jul (1,056) |
| Storage Unit creations | 2,874 | 16 Jul (478) |
| Fuel withdrawals | 1,064 | 16 Jul (151) |
| Location reveals | 258 | 17 Sep (42) |
| Gate links | 119 | 16 Jul (26) |
| Ownership transfers | 5 | 16 Jul (2) |
Weekly active players started at 667 and bottomed out at 261 in the week ending 10 Sep. Then they ticked back up, 306 for the last full week and 321 in the closing 5.4 days, so the last few weeks held up better than the stretch just before them. The daily view says the same thing at finer grain. The best day of the cycle was 28 June with 334 chain-active players, and the last full week averaged about 118 a day.
At halfway the story was fewer players each doing more, and that mostly held. Recorded events per active player went from 51 a week in week one to a high of 157 in the week ending 6 Aug, and finished the last full week at 117. The usual caveat applies: a player who logs in and explores or rats without touching a structure or the chain is invisible here, so this is a trend line, not a census. On activity rather than kills, the busiest player tribe was Reapers with 32,662 recorded events.
Table view
| Week ending | Active players | Active tribes | Events per active player |
|---|---|---|---|
| 2 Jul | 667 | 33 | 51 |
| 9 Jul | 537 | 38 | 62 |
| 16 Jul | 602 | 45 | 140 |
| 23 Jul | 556 | 48 | 118 |
| 30 Jul | 459 | 45 | 128 |
| 6 Aug | 401 | 36 | 157 |
| 13 Aug | 358 | 38 | 155 |
| 20 Aug | 366 | 38 | 145 |
| 27 Aug | 359 | 33 | 137 |
| 3 Sep | 308 | 38 | 152 |
| 10 Sep | 261 | 40 | 150 |
| 17 Sep | 264 | 37 | 113 |
| 24 Sep | 306 | 35 | 117 |
Shared storage and items
Shared storage is the closest thing I have to a trade volume number. EF-Map's storage-flow table covers the whole cycle, unlike the Activity Tracker rows that only started in August, and it recorded 18,488 item transfers between storages by 177 characters across 233 Storage Units. The busiest week was the one ending 16 July with 2,706. The busiest storages were IKEA, Trinary Exchange, Sam's Club and Market, and I'll leave the naming conventions without comment.
| Storage Unit | Deposits and withdrawals | Characters |
|---|---|---|
| IKEA | 2,266 | 20 |
| Trinary Exchange | 1,986 | 32 |
| Sam's Club | 1,412 | 2 |
| Market | 1,146 | 20 |
| Costco - I8V-PCH | 888 | 11 |
By volume, what got minted into on-chain inventory was mostly raw material and fuel. Silicon Dust leads with 135,281,831 units over the cycle, and roughly 75% of that was burned again, which as far as I can tell is industry eating it.
| Item | Units minted | Units burned |
|---|---|---|
| Silicon Dust | 135,281,831 | 101,682,716 |
| Water Ice | 109,233,895 | 62,346,836 |
| Nickel-Iron Veins | 101,315,194 | 78,321,347 |
| Tholin Aggregates | 53,615,217 | 49,361,651 |
| D1 Fuel | 36,265,872 | 25,468,925 |
| SOF-40 Fuel | 24,889,648 | 15,314,726 |
The numbers stop here
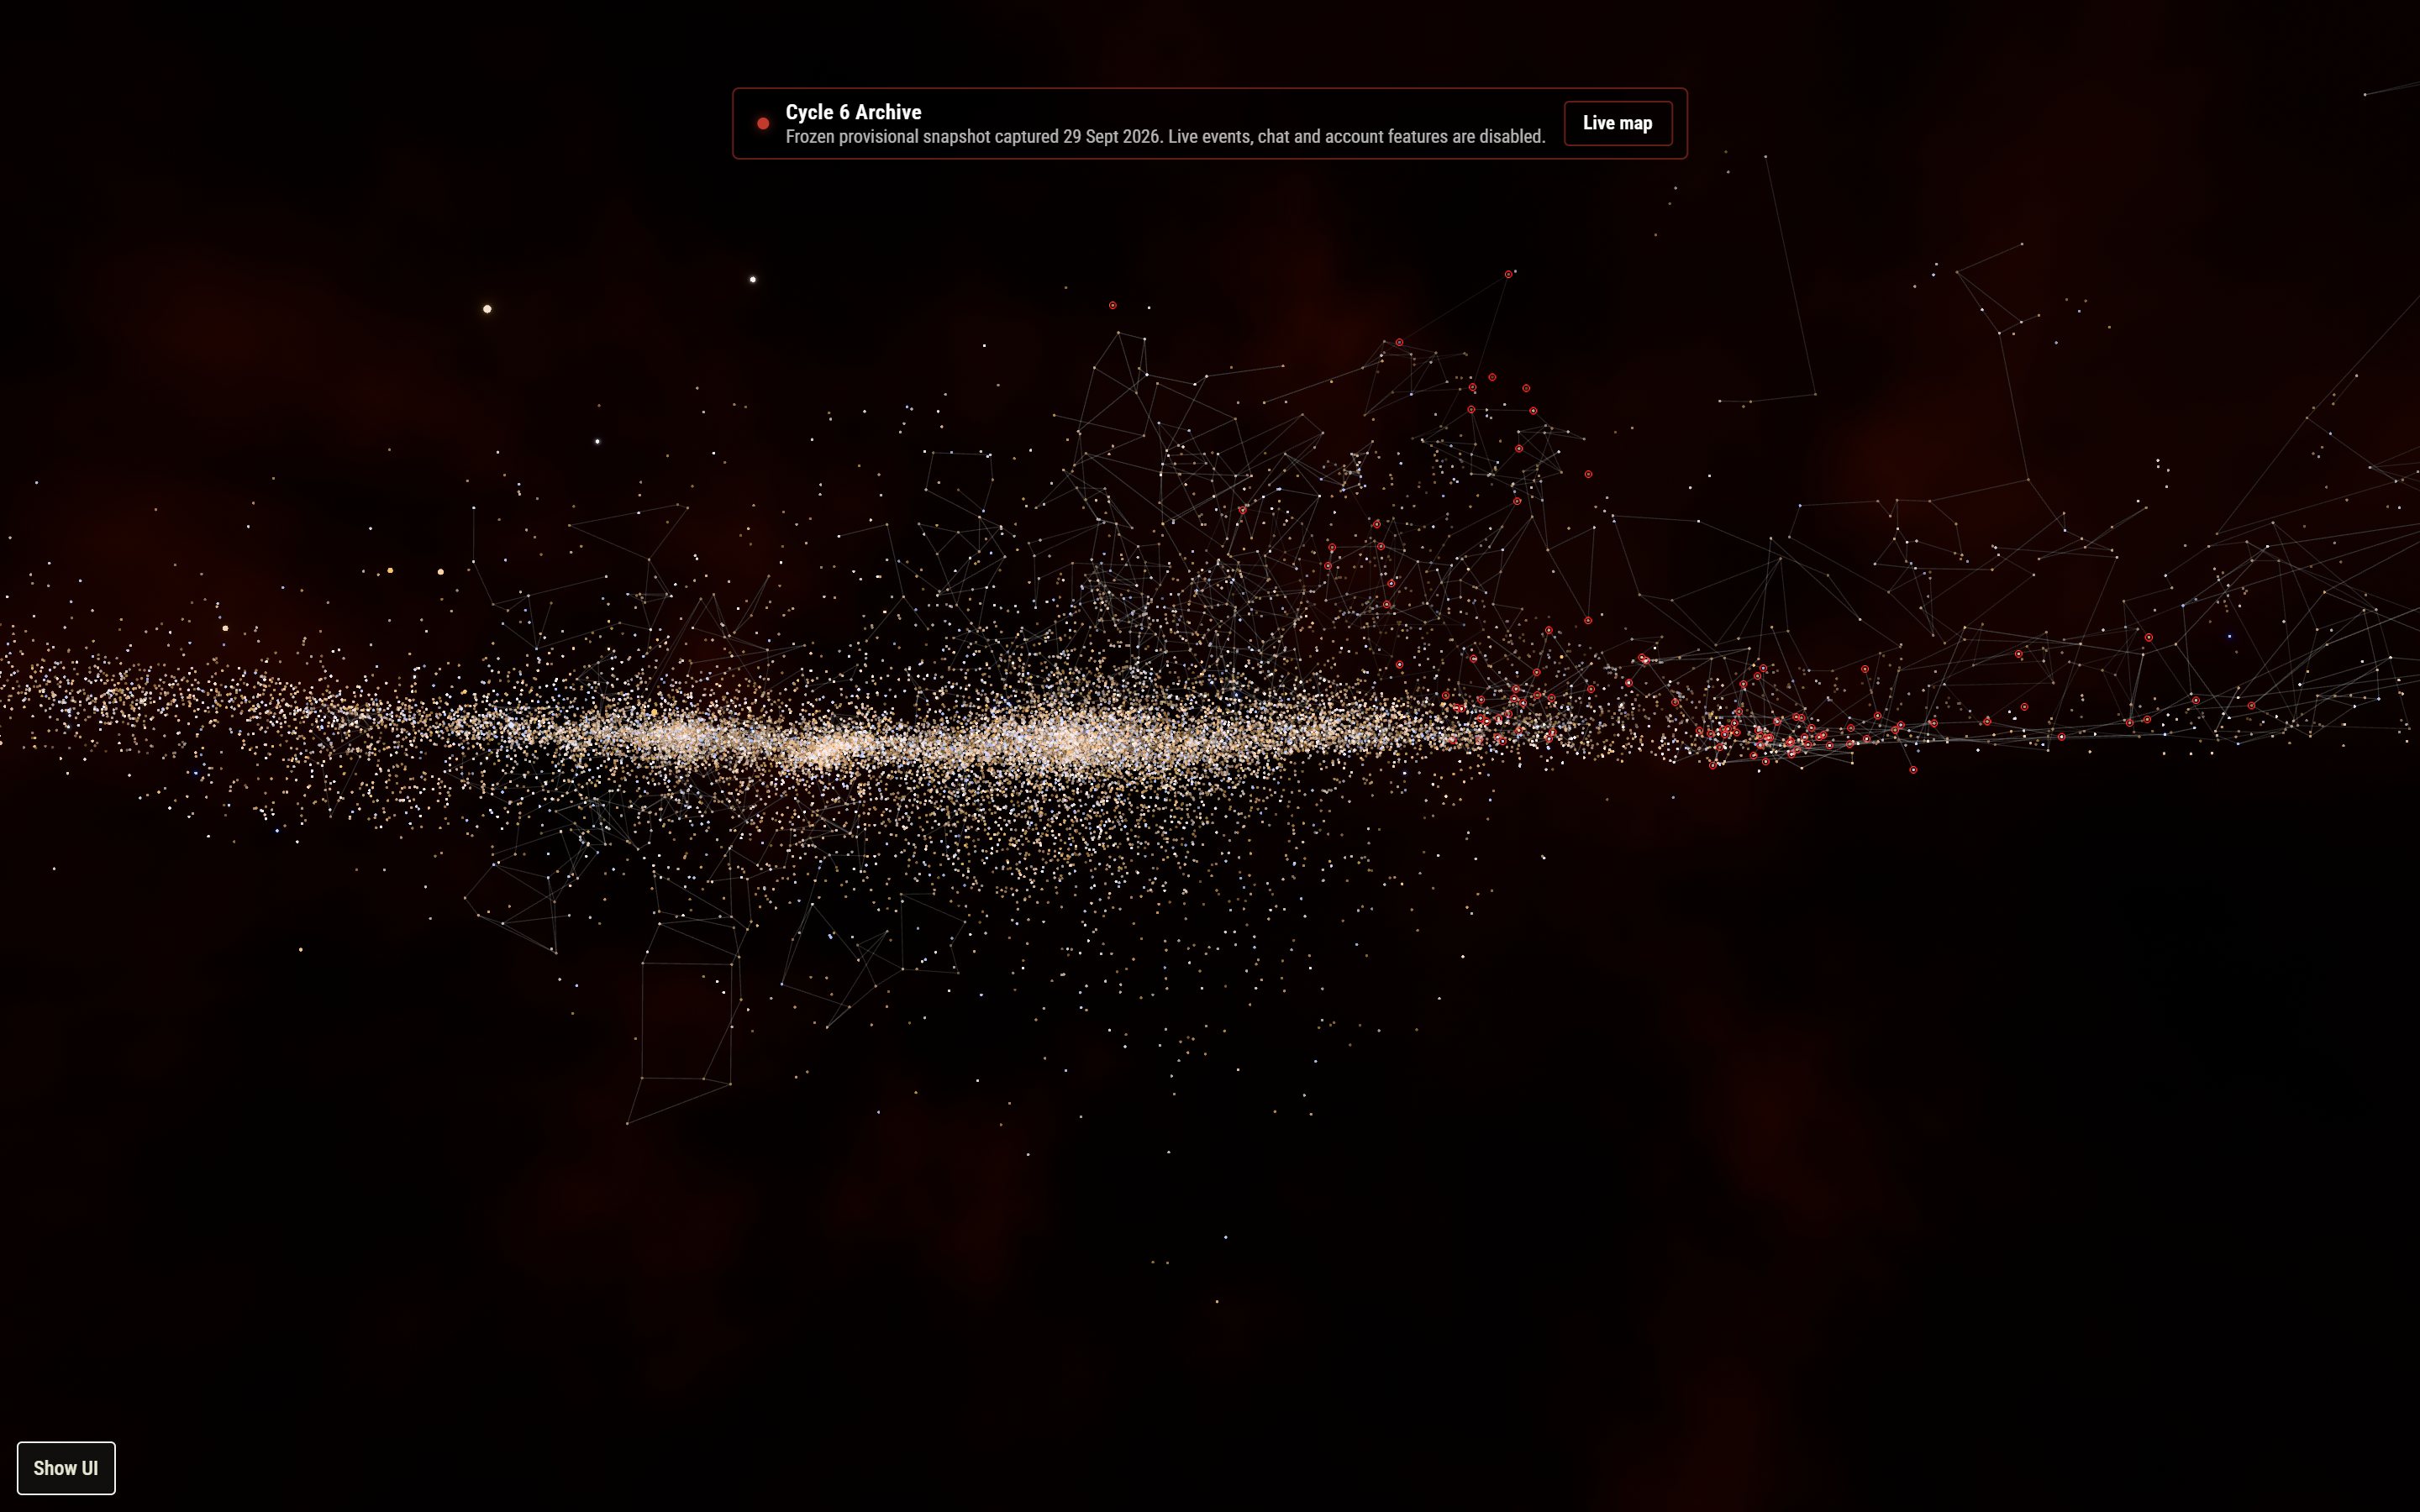
That's Cycle 6. EF-Map's live data moves on to Cycle 7 today, so apart from the odd straggling killmail these numbers are final. If you want to poke at it yourself, the map, killboard, Smart Assemblies and Activity Tracker for the whole cycle stay browsable as a frozen, read-only archive at ef-map.com/cycle6, the same way Cycle 5 is.
Cycle 7 brings Fog of War, which changes a lot about what a map can know, and I wrote about what that could mean for EF-Map a couple of weeks ago. The weekly State of the Frontier picks up again once there's a full Cycle 7 week to report on, and if the data allows it there'll be a Cycle 7 version of this post in about three months. No promises on how much of the map it'll be able to show.
As always, this is recorded on-chain activity, an undercount of real play by some margin I can't measure. If your tribe's beef explains one of the spikes, or you spot something in the tables I've missed, let me know and I'll add it.
Related Posts
- Halfway Through Cycle 6: Seven Weeks of EVE Frontier Data - the same treatment at the midpoint of the cycle
- EVE Frontier Cycle 7 Fog of War: What It Could Mean for EF-Map - what changes for the map next cycle
- Preserving Cycle 5: The First EF-Map Cycle Archive - how the frozen cycle archives work
- State of the Frontier: How EF-Map Turns Universe Data Into a Weekly Report - the pipeline behind the weekly numbers