Every Friday since the start of July I've published a State of the Frontier report, a weekly snapshot of recorded EVE Frontier activity built from EF-Map's indexed Sui data. Each one covers a single cycle week and compares it with the week before, which is useful but has no memory. Cycle 6 started on 25 June 2026, cycles run roughly three months, the last one ran three and a half, so mid August is the halfway mark, give or take. Seven weekly reports felt like enough to read across rather than down, so this is that: the same numbers the weeklies printed, laid end to end, with the trends a one-week window cannot see.
How to read this
Everything here comes from the seven published weekly fact packs, weeks ending 2 July through 13 August 2026. It is all recorded on-chain activity as EF-Map's indexer saw it: player-triggered events, not logins, not concurrent players, and not anything that happens off-chain. Weekly windows run midnight UTC Wednesday to Wednesday. The killboard indexer backfills late-arriving kills, so a week's number can drift up a few percent after its report is published; I've used what each week's own fact pack recorded. Week one has no earlier week to compare against because comparisons never cross the cycle wipe.
Cycle 6 at a glance
| Week ending | Recorded kills | Active players | Activity events | Events per player | Online structures | Active gate links |
|---|---|---|---|---|---|---|
| 2 Jul | 869 | 667 | 33,913 | 51 | 2,088 | 0 |
| 9 Jul | 297 | 537 | 33,354 | 62 | 3,062 | 3 |
| 16 Jul | 762 | 602 | 84,317 | 140 | 3,725 | 25 |
| 23 Jul | 370 | 556 | 65,377 | 118 | 4,021 | 37 |
| 30 Jul | 474 | 459 | 58,818 | 128 | 4,172 | 43 |
| 6 Aug | 512 | 401 | 63,118 | 157 | 4,264 | 58 |
| 13 Aug | 347 | 358 | 55,444 | 155 | 4,157 | 72 |
Two stories sit in that table and they pull in opposite directions. The weekly active player count has nearly halved since the cycle opened. And almost every measure of what those players actually do per head has gone up, some of them a lot. The rest of this post is me walking through both, section by section, with the caveat up front that I run a map site, not a research department, so treat the interpretation as informed guessing and the tables as the actual product.
Kills never found a trend
Week one recorded 869 kills, still the bloodiest week of the cycle by some distance, which is what you'd expect from a fresh wipe: everyone lands in cheap ships, nobody has anything to lose, and the land grab sorts itself out the traditional way. After that the line refuses to be a line. It went 297, 762, 370, 474, 512, 347. If there's a pattern in that, I can't see one, and I think that's the honest reading: fights in the Frontier are event-driven, not scheduled. Beef boils over between two tribes, somebody's structures start looking killable, somebody bumps into somebody else over a rift, and that week's number doubles.
Table view
| Week ending | Recorded kills | Structure kills | Systems with kills | Unique killers | Unique victims |
|---|---|---|---|---|---|
| 2 Jul | 869 | 0 | 26 | 123 | 651 |
| 9 Jul | 297 | 145 | 31 | 52 | 212 |
| 16 Jul | 762 | 614 | 35 | 67 | 399 |
| 23 Jul | 370 | 281 | 34 | 39 | 231 |
| 30 Jul | 474 | 375 | 34 | 43 | 309 |
| 6 Aug | 512 | 324 | 32 | 44 | 331 |
| 13 Aug | 347 | 183 | 34 | 35 | 255 |
What did trend is who's doing the killing. Week one had 123 unique killers sharing those 869 kills, about seven each. The latest week had 35 killers taking 347, about ten each. So the casual land-grab violence has drained out and what's left is the people for whom shooting other players is the job. The scoreboard rotation tells the same story with names on it: Reapers topped the first two weekly tribe tables, Shadow - Moses took week three, and The Ancients have topped three of the last four, with Clonebank 86 taking the other. Pilgrim and Cowboy have each led the individual killboard twice. Structure kills, the blue line, peaked at 614 in the week ending 16 July and have eased since, which lines up with the siege-heavy stretch in the middle of the cycle.
Activity spikes when patches land
Recorded player-triggered activity ran at around 34,000 events a week for the first two weeks, then the week ending 16 July recorded 84,317, two and a half times the baseline and still the cycle's peak. The 14 July patch landed in the middle of that window carrying six new modules and a fuel rework, and I don't think that's a coincidence, though I'll hedge it as usual because a bar chart can't prove causation. What it can show is what people did: items minted went from 15,081 to 45,906 that week and items burned tripled too. When new modules arrive, the Frontier goes to the factory.
Table view
| Week ending | Activity events | Unique players | Unique tribes |
|---|---|---|---|
| 2 Jul | 33,913 | 667 | 33 |
| 9 Jul | 33,354 | 537 | 38 |
| 16 Jul | 84,317 | 602 | 45 |
| 23 Jul | 65,377 | 556 | 48 |
| 30 Jul | 58,818 | 459 | 45 |
| 6 Aug | 63,118 | 401 | 36 |
| 13 Aug | 55,444 | 358 | 38 |
The event mix has also been shifting under the surface, and the full breakdown table below is probably the most information-dense thing in this post if you like this sort of thing. Jump events barely existed in the first fortnight, 43 recorded in week two, then 1,552 the week after as the player-built gate network started carrying real traffic. And two event types new to the table, item deposits and item withdrawals, show up in the week ending 6 August at 535 each and 1,406 each the week after. That one is a tracking change, not a game change: these are shared storage movements, items shifted between storages inside a Storage Unit, usually because they've been bought or sold between players, with TRIX-EX being the biggest of those storages. The activity existed earlier in the cycle, EF-Map just wasn't recording those two event types until August, which is also why the counts arrive as identical pairs: an item leaving one storage arrives in another. So treat those rows as a new window opening rather than a new behaviour starting, and from here on as a rough proxy for player-to-player trading volume.
Recorded events by type, all seven weeks
| Event type | 2 Jul | 9 Jul | 16 Jul | 23 Jul | 30 Jul | 6 Aug | 13 Aug |
|---|---|---|---|---|---|---|---|
| Items minted | 12,473 | 15,081 | 45,906 | 33,900 | 32,332 | 34,813 | 29,995 |
| Items burned | 6,500 | 7,339 | 21,950 | 17,441 | 14,192 | 16,404 | 14,061 |
| Structures brought online | 4,869 | 4,352 | 5,750 | 4,777 | 4,616 | 4,328 | 3,235 |
| Structure anchors | 3,891 | 2,408 | 3,457 | 2,697 | 2,426 | 1,999 | 1,447 |
| Assembly creations | 2,530 | 1,658 | 2,240 | 1,781 | 1,673 | 1,335 | 964 |
| Fuel burn starts | 2,161 | 1,628 | 2,098 | 1,728 | 1,562 | 1,337 | 1,112 |
| Network Node creations | 1,056 | 501 | 701 | 611 | 462 | 404 | 293 |
| Storage Unit creations | 305 | 240 | 478 | 289 | 273 | 244 | 178 |
| Fuel withdrawals | 120 | 85 | 151 | 141 | 86 | 73 | 55 |
| Location reveals | 8 | 16 | 6 | 7 | 10 | 3 | 10 |
| Jumps | - | 43 | 1,552 | 1,993 | 1,180 | 1,096 | 1,277 |
| Gate links | - | 2 | 26 | 10 | 6 | 12 | 5 |
| Ownership transfers | - | 1 | 2 | 2 | 0 | - | - |
| Item deposits | - | - | - | - | - | 535 | 1,406 |
| Item withdrawals | - | - | - | - | - | 535 | 1,406 |
Fewer players, doing more
Now the uncomfortable line, and I gave the honest version of this in my 18-month review so I'm not going to soften it here. Weekly chain-active players went from 667 in week one to 358 in week seven, a 46% fall. That's the pattern every cycle follows to some degree as people exhaust the content and park until the next wipe, but the size of it is the size of it.
Here's the counterweight, and it's why I wanted to write this post at all. Recorded events per active player went from 51 a week to 155 a week, three times the opening rate, and it has not been below 118 since the modules patch week. Total weekly activity is still 63% above week one on barely half the players. So the population isn't so much shrinking as concentrating: the people who drifted off were doing 50 events a week, and the people still here are doing 155. Worth remembering what this measures, though. Chain-recorded events only. A player who logs in and rats or explores without touching a structure or the chain is invisible to this data, so the real population sits somewhere above these lines, and this is a trend line, not a census.
Table view
| Week ending | Active players | Events per active player |
|---|---|---|
| 2 Jul | 667 | 51 |
| 9 Jul | 537 | 62 |
| 16 Jul | 602 | 140 |
| 23 Jul | 556 | 118 |
| 30 Jul | 459 | 128 |
| 6 Aug | 401 | 157 |
| 13 Aug | 358 | 155 |
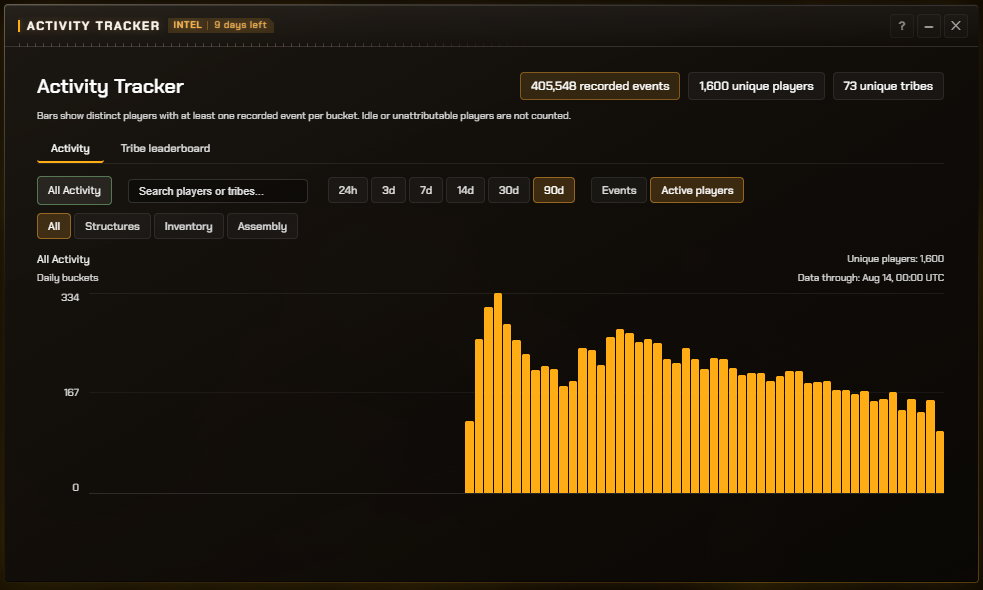
The daily view from the Activity Tracker tells the same story at finer grain, and across the whole window it has now seen 1,600 unique players and 73 unique tribes touch the chain this cycle. Daily chain-active players peaked above 330 in the opening days and sit in the 140 to 170 range now.
The build-out never stopped
If the player line is the pessimist's chart, this one belongs to the optimists. Standing assemblies, meaning everything anchored in space that the indexer tracks, went from 4,191 at the end of week one to 18,642 now, and the count has risen every single week of the cycle. Online structures went from 2,088 to a peak of 4,264, though week seven brought the first dip of the cycle, down about a hundred to 4,157, which is worth a raised eyebrow but not a conclusion; sieges and fuel lapses knock structures offline all the time and one week isn't a trend.
Table view
| Week ending | Standing assemblies | Online structures | Status changes | Active gate links |
|---|---|---|---|---|
| 2 Jul | 4,191 | 2,088 | 7,868 | 0 |
| 9 Jul | 6,818 | 3,062 | 8,463 | 3 |
| 16 Jul | 10,250 | 3,725 | 11,448 | 25 |
| 23 Jul | 12,995 | 4,021 | 10,403 | 37 |
| 30 Jul | 15,036 | 4,172 | 10,249 | 43 |
| 6 Aug | 17,264 | 4,264 | 9,901 | 58 |
| 13 Aug | 18,642 | 4,157 | 7,548 | 72 |
The construction rate is a different shape from the construction total, and the decay is textbook settlement. Structure anchor events fell from 3,891 in week one to 1,447 last week, Network Node creations from 1,056 to 293, assembly creations from 2,530 to 964. The frontier got built, mostly in the first month, and what's left now is running it rather than expanding it. The one build number that has never once gone down is the Smart Gate network: zero active player-built gate links at the cycle start, 72 now, up every single week. Quietly, while the population argued about everything else, somebody kept laying track.
The second half
What I'd watch from here, and this is informed guessing rather than data: whether the 350-player core holds or keeps eroding, whether shared storage trading keeps growing now it's on the board, and whether the gate network keeps its unbroken streak. The nearest test is already scheduled: a mid-cycle patch lands on 18 August, outlined in today's Frontier Friday, bringing a second ship plus a set of other changes, and if it lands well the player line should show it within a week or two. History also says the back half of a cycle gets at least one big developer-run event, the kind that ended last cycle with a bang at Exti, and every one of those shows up in these charts within a week. The weekly State of the Frontier keeps publishing every Friday regardless, and when the cycle ends I'll do the full-cycle version of this post with the complete record.
All of it comes from EF-Map's own indexer, and the usual caveat applies twice over at halfway scale: this is recorded on-chain activity, an undercount of real play by some unknowable margin. If you spot a trend in these tables I've missed, or your tribe's beef explains one of the kill spikes, let me know and I'll update the post.
Related Posts
- My EVE Frontier Review After 18 Months of Founder Access - the honest population picture, with opinions attached
- How the State of the Frontier weekly report gets made - the verifier-driven pipeline behind the source data
- Exti and the Shroud of Fear - what a cycle-end event looks like when it lands
- Half a million light-years saved - the same treatment applied to EF-Map's own usage data