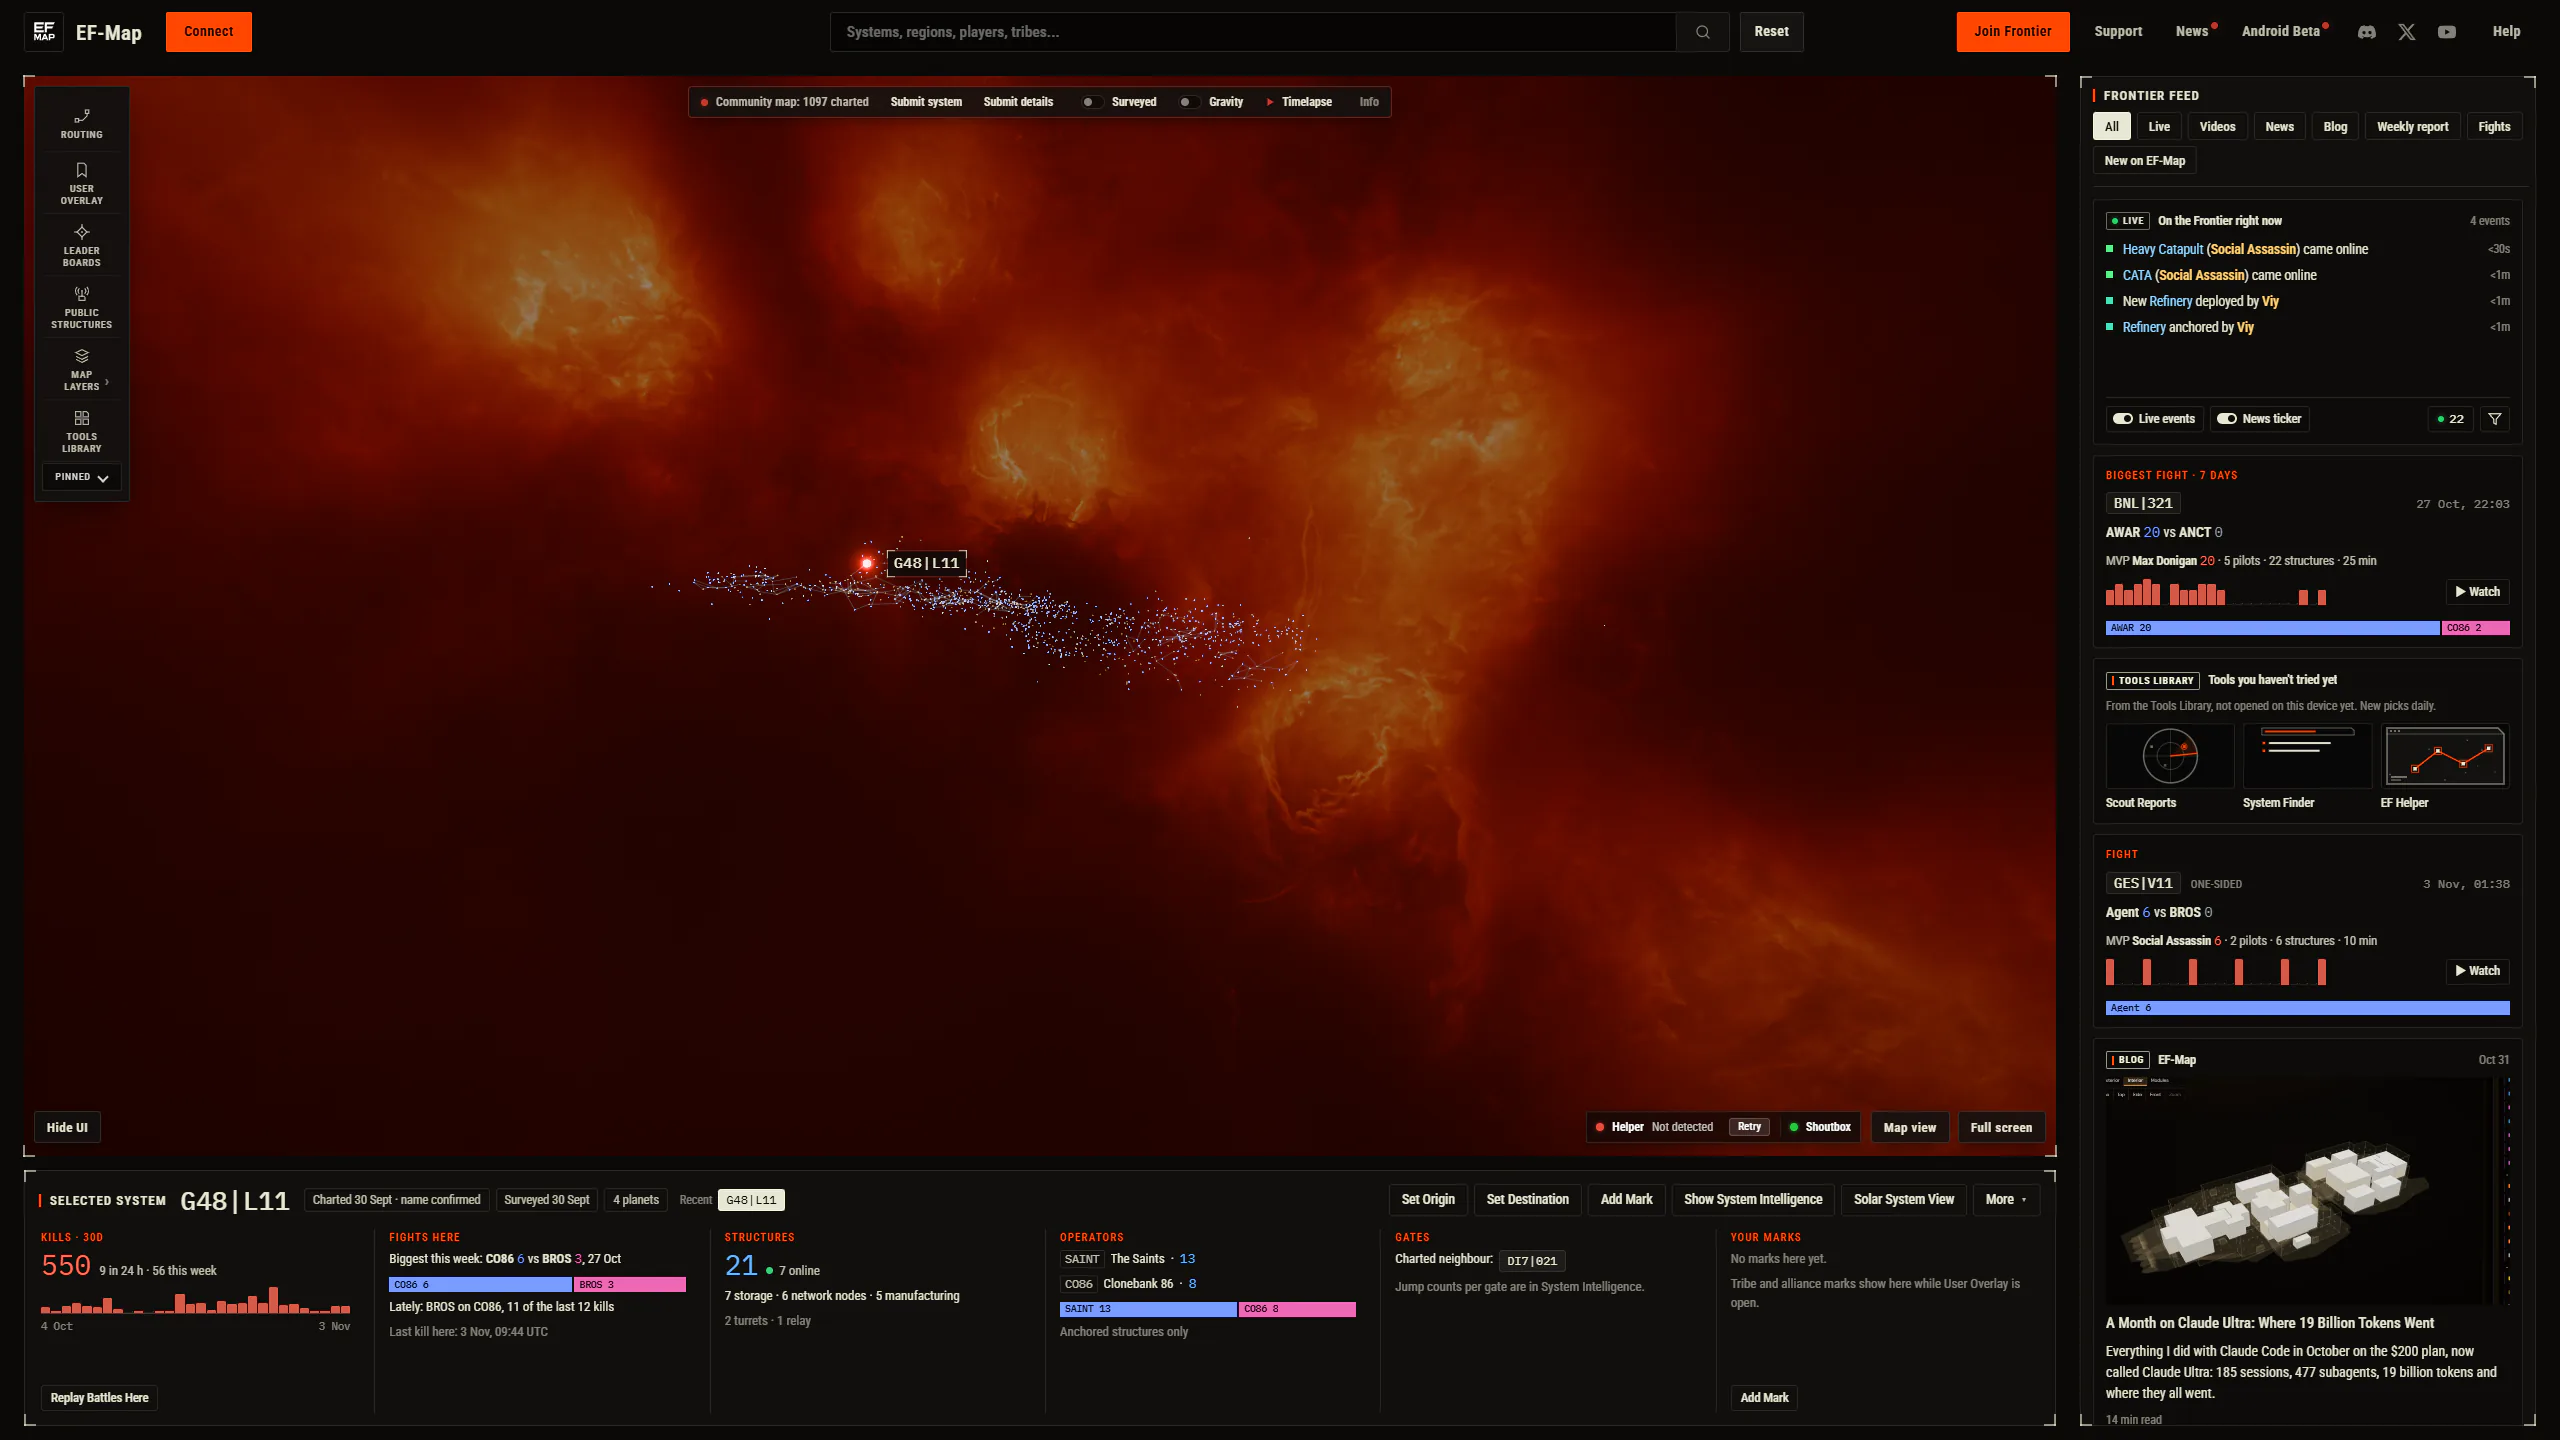
I made the mistake of watching YouTube on my 32 inch 1440p monitor without going full screen. The video sits in a box, the comments and the next videos fill the rest, and it all just works. Then I alt-tabbed to EF-Map and the map was filling the whole screen with the star cluster in the middle and a lot of very expensive dark pixels round the edges. The community map only shows the systems people have charted, so on a big monitor there is a fair amount of dead space, and I kept thinking that space could be telling me something. So I copied YouTube. That is the whole origin story, and this article is about what came out of it, where the feed down the side gets its content from, what the AI behind it costs to run, and, because I find this stuff fascinating, what it actually took to build.
What Watch view is
It is a second layout, not a redesign. The map goes into a frame with the usual feature bar inside it, under the map there is a page for whatever system you have selected, and down the right there is a feed. Tools still open as the same floating windows they always did, just kept inside the frame. There is a button at the bottom right in both views, Watch view in one and Map view in the other, and T switches between them. F goes full screen in either view, which is the browser's own full screen so it also hides the tabs and address bar. Your choice is remembered, so if you press Map view once you stay there.
If you are on a 1440p monitor or bigger, your next visit will start in Watch view, because otherwise I think most people would never find out it exists. If you are on a 1080p screen you get the button but you start in Map view, which was a decision I went back and forth on. My first version only offered the button to windows wider than 2300 pixels, I tested it at work on a 1080p screen, couldn't find the button, and realised I was suppressing the option for no good reason. So now anything from 1280 by 720 up gets the button. At 1080p the map frame is 1392 by 720, which is fine. At the floor it gets tight. Phones and embedded maps never see any of it. If you are the kind of person who likes the map filling the window, nothing has changed for you, and I mean that literally, which I will get to.
Why not just redesign the map
The main rule I set at the start was that Map view had to stay pixel identical. Not roughly the same, identical. Hundreds of people a month use the map the way it is, some of them on 1080p laptops, and a layout change for the big monitor crowd is not a reason to move anything for them. So before a single line changed, the agent captured a headless baseline of Map view from a production build, nine states, the map at rest, a system selected, a route plotted, the leaderboards open, solar system view, cinematic mode, two of them at 1080p, with every API response recorded so the capture would replay identically, and a frozen clock so the "updated 6d ago" labels would not drift. After every phase of the build it recaptured and compared pixel by pixel. The only difference allowed in Map view is the two new buttons, and the comparison masks that one row. Everything else is 0.0000 percent, which is a number I did not expect to be able to say about a change this size.
The reason that mattered is that making the map fit a frame touched a lot of old assumptions. About 145 places in the code read the window size directly, and about 20 of those were in the render and camera code. Windows placed themselves against the window edges, not a frame. The route systems panel, it turned out, had been opening at the wrong width about half the time since August and nobody had noticed because the difference was 96 pixels. The baseline caught that one too, so it got fixed on the way.
I also went through a few mock-ups before building anything. A side dock where tools open as tabs in a column, a left sidebar like the AI chat apps use, and the watch page. The dock and sidebar both lost because they compromise the wide tools, the killboard in particular, and because nobody asked for tabs. The watch page kept floating windows and gave the map a page and a feed, so that is what got built.
The system page
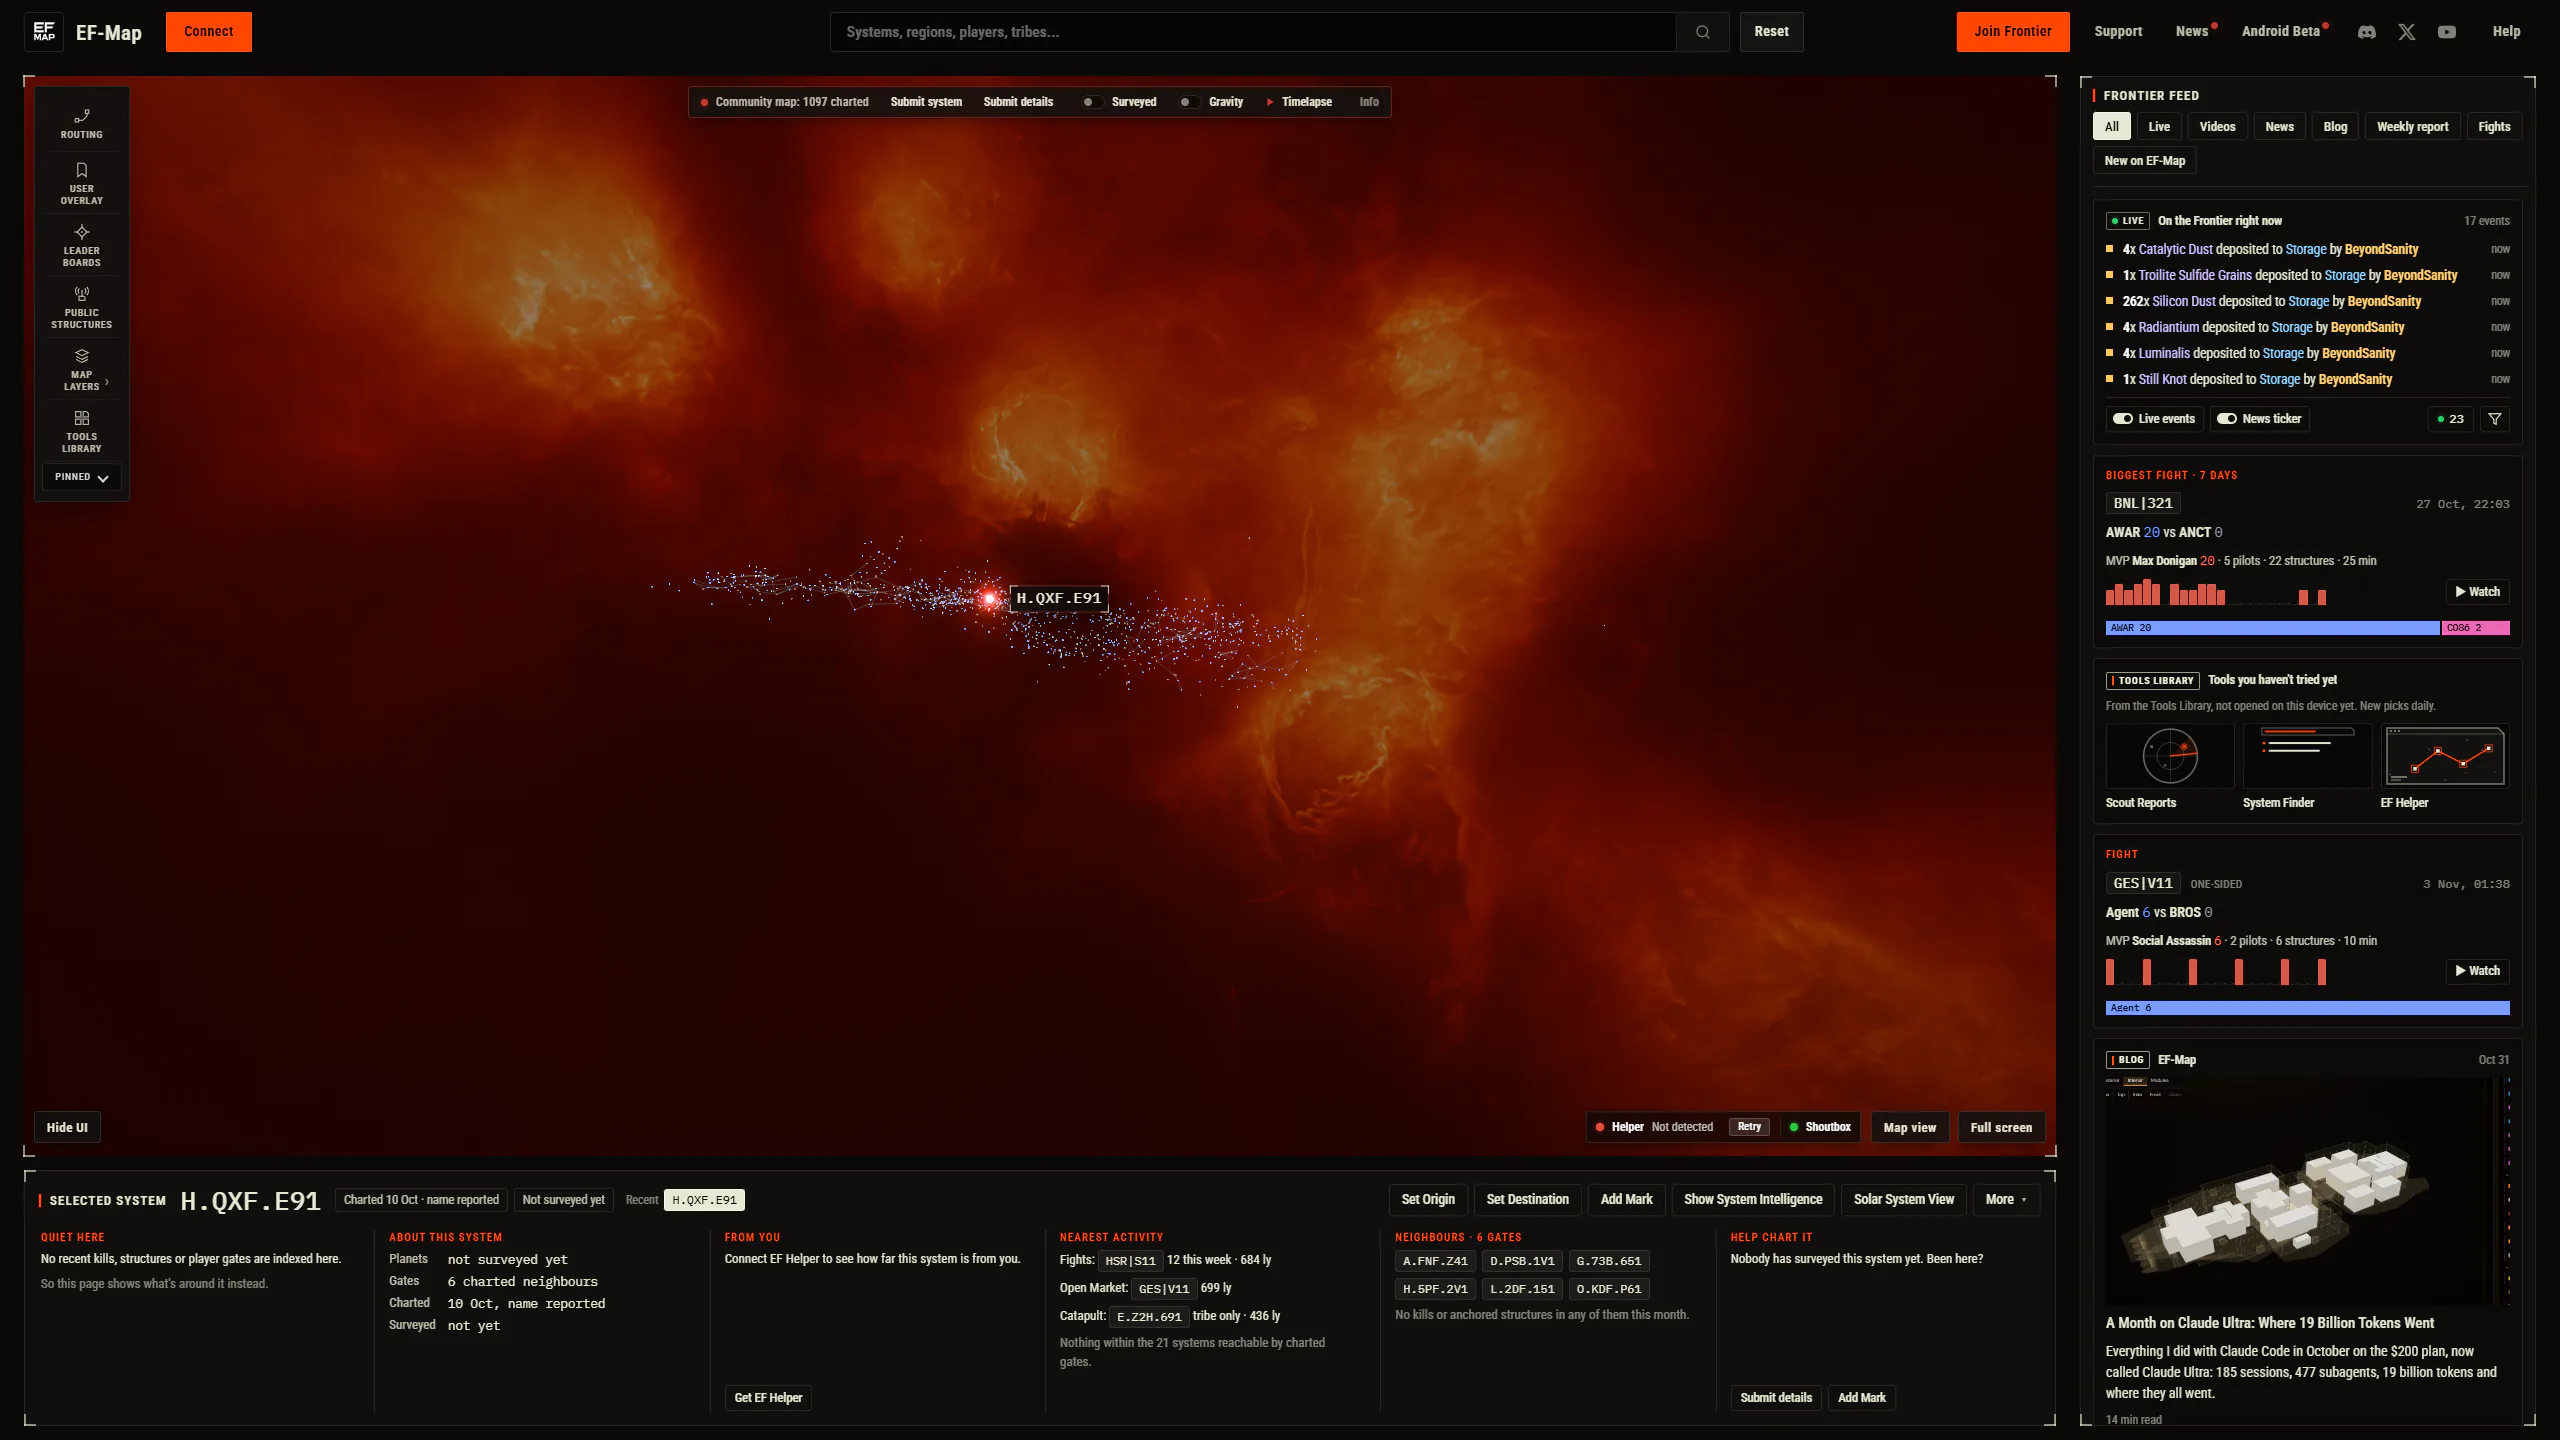
Under the map is a page for the selected system. The header has the name, when it was charted and surveyed, the planet count, your recent systems, and the same actions as the right click menu, so Set Origin, Set Destination, Add Mark, Show System Intelligence, Solar System View and so on. Then six cards, and the rule for the cards was that they must never look empty.

A busy system like G48|L11 gets kills over the last 30 days with a chart and Replay Battles Here, the fights there, the structures and how many are online, the tribes that run them, the gates and your own marks. A quiet system, which is most of them, gets what is known about it, how far it is from you if EF Helper is connected, the nearest fights, the nearest open market and listed gate or catapult in light years, how many systems you can reach through charted gates, its gate neighbours, and a nudge to go and chart it if nobody has. Distance from you and nearest market and gate were new code. Everything else on the page already existed somewhere in the app, in the hover card, the intelligence dossier or the right click menu, it just had nowhere to be shown together.
The Frontier feed, and where it comes from
The feed down the right is the bit I think of as the map's advertising, in the sense that it shows people what is going on and what EF-Map can do without them having to go looking. Every source is one adapter, so adding one is a file and a line, which matters because I have an eye on a couple more. Here is what is in it today.
| Card | Where it comes from | How often it updates |
|---|---|---|
| Live events | The same websocket the live events ticker uses, plus 72 hours of history kept in your browser | Instantly, as events arrive |
| Fights | The killboard timeline, using the Fights tab's own rule, biggest fight of the week pinned | Every 5 minutes |
| News and videos | The Claude news curator on my server, official news, YouTube, Twitch, r/EVEFrontier | Every 10 minutes while the feed is open |
| Blog | The blog index, with each post's own picture | Once per visit |
| Weekly report | State of the Frontier, newest issue | Once per visit |
| New on EF-Map | The What's new catalog, each with its Tools Library sketch | Once per visit |
| Tools you haven't tried | Three Tools Library tools this browser has not opened, picked daily | When you open one |
| Community map | The charted system count, with Submit system | On load |
Two things about the live card. The ticker along the bottom of Map view is a marquee, so events queue up behind each other and scroll past at a steady pace, and when nothing is happening for a minute it drops in one of its quiet time phrases. That makes it look busier than reality. The feed card shows events the moment they arrive, in fixed rows that never shift the cards below, and when I measured both views side by side for 100 seconds they received exactly the same 17 events. The data is identical, the presentation is honest in one and smoothed in the other. I had convinced myself the feed was dropping events before I measured it.
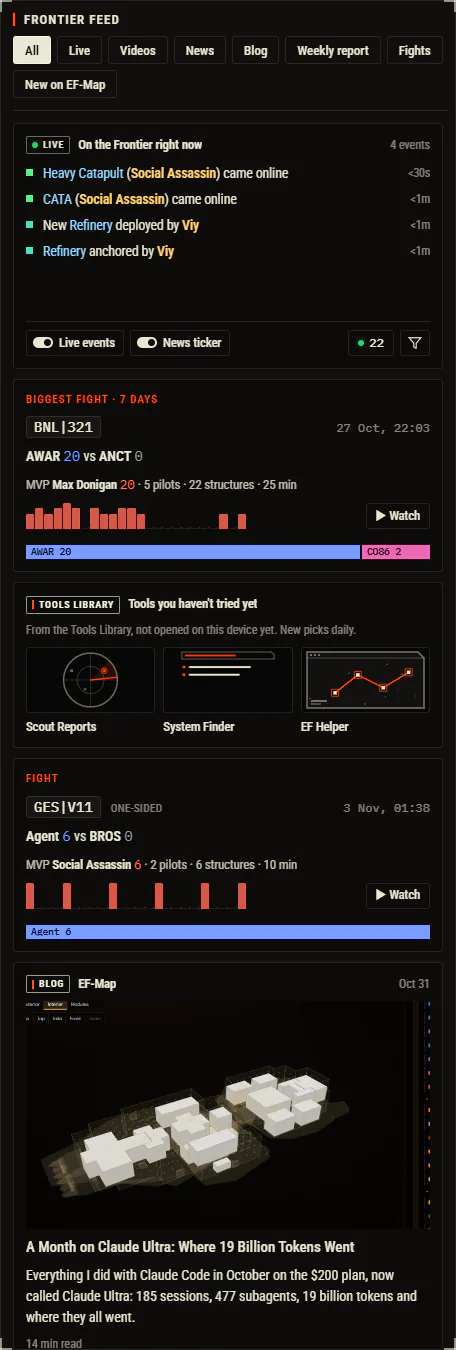
The other is the mixing. The newest things in the feed are usually fights, so the first version opened with three fight cards in a row, which was dull. Now the feed is interleaved so you do not get two cards of the same kind next to each other where it can help it, with the live card and the week's biggest fight pinned at the top.
The news curator
The news cards deserve their own section because they are the part that uses the AI credit. The news ticker along the bottom of Map view has been written by Claude since October. A job on my VPS runs every 10 minutes, pulls the sources through the site's own worker, has Sonnet read each new item once and write a digest, has Opus pick and write the ticker lines when something changed, and has Sonnet translate the lines into the six other languages the site runs in. Every number in a line has to appear in the item's own text or the line is thrown out, Reddit users are never named, and the developer is always Fenris Creations or FC.
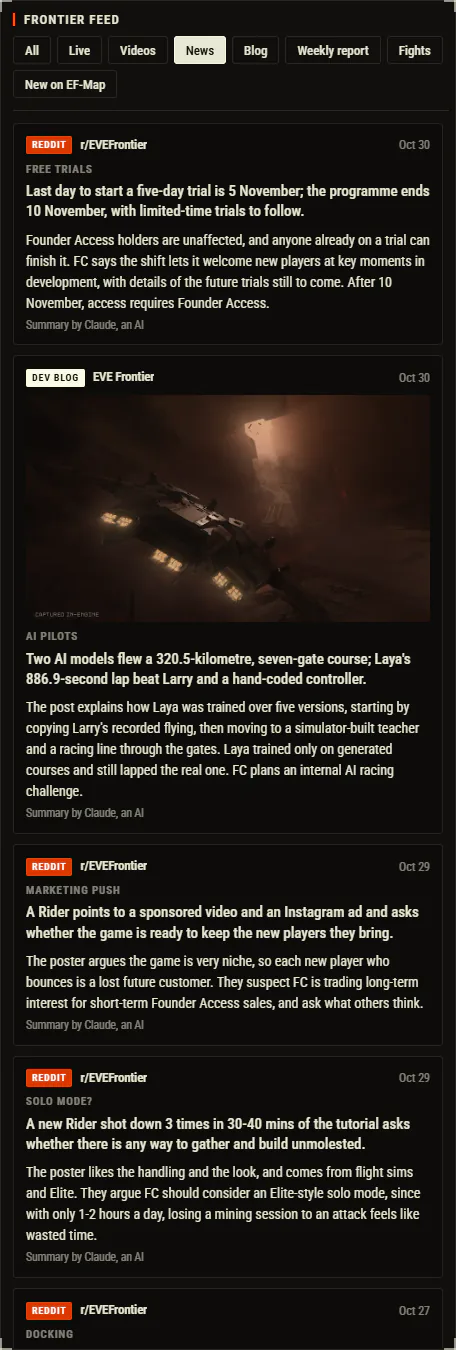
For the feed I extended that. The curator now also writes a feed edition beside the ticker, which is every newsworthy item it read rather than the 10 to 20 lines the ticker has room for, so the videos chip went from three videos to about ten. Each item gets a one to three sentence summary, written once, cached by content, checked by the same number guard, and translated. The source's real picture comes with it where there is one, the YouTube thumbnail or the official article's image. Reddit posts only make it into the feed if the editor chose them for the ticker, and a Reddit picture only shows after Haiku has looked at it and said it is safe and on topic, with a 320 pixel minimum because the first one it passed was a 140 pixel screenshot that would have been a blur.
| What | Cadence or cost |
|---|---|
| Source bundle refresh | Every 10 minutes |
| Ticker rewrite when sources changed | At most every 15 minutes |
| One feed summary plus six translations | About $0.011 |
| News job, October 2026 | $4.68 for the month |
| News job, projected after this change | About $8 to $16 a month |
| Daily caps in code | $3.50 for news, $5 for every scheduled job |
Those dollars are API list prices. The jobs run on the API credit that comes with the Claude subscription, $200 a month that expires if you do not use it, shared with EO-Map. The caps in the code are there to stop a runaway, not to budget, and the morning ops note on the server tells me what was spent the day before. The honest summary is that the richer feed costs about a tenth of the credit and I have headroom for a lot more sources before it matters.
One more source is new and I am curious how it goes. YouTube does not expose video tags or the game title publicly, so there is no way to ask it for everything tagged EVE Frontier. The closest is a date ordered search for the phrase in the gaming category, which the worker now does once an hour, drops shorts, and caps unknown channels at a handful of videos. The reader then judges whether a video is really about EVE Frontier by Fenris Creations or an unrelated use of the words and marks the noise as noise. So creators I have never heard of should start appearing, and if that goes badly I will tighten it.
What it took to build
This is the section I wanted to write. Claude Code keeps a transcript of every session on my machine, so I had an agent go through the logs for the two sessions that made this, the mock-up session and the build session, and count. The build was one long autonomous run, started on the Sunday afternoon and finished on the Monday morning, with me asleep for a good chunk of it, then a second round on the Monday from my feedback on the preview.
| Measure | Figure |
|---|---|
| Sessions | 2 (mock-ups, then build and feedback) |
| Wall clock, first to last log line | 20 hours 7 minutes |
| Time with at least one agent working | 14.1 hours |
| Summed agent time | 21.5 hours (3.6 main, 17.9 subagents) |
| Subagents | 33 (23 Opus 5.5, 10 Sonnet 5.5) |
| Peak agents running at once | 5 |
| Tool calls | 5,219 |
| Tokens processed | 1.44 billion, 98 percent of them cache reads |
| API equivalent cost through the release | $513 (Opus $384, Fable $110, Sonnet $27) |
| Messages from me | 18, about 9,700 words |
| Commits merged | 76 |
| Files changed | 286, plus 21,125 lines and minus 681 |
| Test files added | 42 |
| Translated strings added | 186, in 7 languages |
So nine and a half thousand words from me. Most of that was the brief, which I dictated after the mock-ups: the decisions already made, the seven phases, the rules, what done means. The orchestrating agent, Fable 5.1, then ran the whole thing: it spawned Opus subagents to build each phase in their own worktrees, had a different Opus agent attack every phase's work before moving on, and merged the results. Five adversarial reviews in the first run, one more in the second, and every finding is either fixed or waived in writing in a ledger document that lives in the repo. The ones it caught were the sort of thing I would never have spotted: a reduced motion setting that wrote the wrong window positions back, the Connect button remounting on every switch and minting a second pairing code, a hidden ticker quietly emptying its own queue, Reddit posts the editor had rejected getting into the feed with unscreened images.
$513 is what the same tokens would cost on the API. I did not pay that, I pay the subscription, and the October article covers that arithmetic. What I take from it is that a feature this size, roughly 21,000 lines including tests and translations, cost a day of wall clock and under a thousand dollars of equivalent compute, and the review step is where a good chunk of that went. I would not skip it.
The second round is the part worth telling people who build this way. I woke up, played with the preview, and dictated a wall of text about muscle memory. The helper pills had moved to the left and Hide UI to the right, the logo had stopped turning with the map, the toolbar buttons were different sizes from the search box, the live events jumped when a line wrapped, three fights in a row at the top of the feed, no pictures on blog posts, and a card from the mock-up had gone missing. None of it was broken. All of it was wrong. The agent split that into three parallel streams, the chrome, the feed, and the news curator, fixed the lot, reviewed it again, and had a new preview up in about three hours. That loop, me using the thing and complaining in plain English, is where the design actually gets made.
What is next
EO-Map, my EVE Online map, is getting the same treatment, and I think it might suit it even better. That game is mature, there is far more news, more creators, more going on in a day, and the feed could be properly busy. The agent wrote the port notes as it went, every gotcha from the window sizing to the harness, so that run should be shorter.
I have also been talking to Flaud about Lagrange Social, which is a wallet based social feed for EVE Frontier, about pulling his posts into the feed as another adapter. Nothing agreed yet. And the space under and beside the map is now there for whatever I want to surface next, which was the point. The map does not get any smaller for the people who want the map.
If you are on a big monitor, have a look and tell me what feels wrong. The second round came entirely from that kind of feedback and I expect there is a third in it.
Related Posts
- A Month on Claude Ultra: Where 19 Billion Tokens Went - the October usage numbers, and why API prices are not what I pay
- Old Features, Newer Models: Refreshing EF-Map's Intelligence Card - the same loop on a smaller job, a dictated brief, a reviewer agent, then me using it
- Couldn't See It for Looking at It: Making EF-Map's Tools Easier to Find - where the What's new catalog and the Tools Library sketches in the feed came from
- Polishing EF-Map: Turning 12 Months of UI Into One System - the last big pass over the map's interface, also done without redesigning the map